3D XPoint nvm pm scm storage class memory

Part III – 3D XPoint server storage class memory SCM


Storage I/O trends

Updated 1/31/2018

3D XPoint nvm pm scm storage class memory.

This is the third of a three-part series on the recent Intel and Micron 3D XPoint server storage memory announcement. Read Part I here and Part II here.

What is 3D XPoint and how does it work?

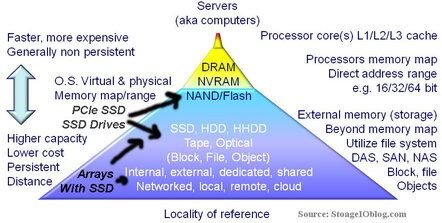
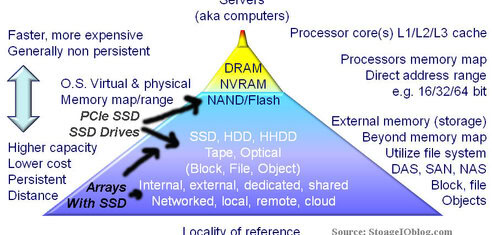
3D XPoint is a new class or class of memory (view other categories of memory here) that provides performance for reads and writes closer to that of DRAM with about 10x the capacity density. In addition to the speed closer to DRAM vs. the lower NAND flash, 3D XPoint is also non-volatile memory (NVM) like NAND flash, NVRAM and others. What this means is that 3D XPoint can be used as persistent higher density fast server memory (or main memory for other computers and electronics). Besides being fast persistent main memory, 3D XPoint will also be a faster medium for solid state devices (SSD’s) including PCIe Add In Cards (AIC), m2 cards and drive form factor 8637/8639 NVM Express (NVMe) accessed devices that also has better endurance or life span compared to NAND flash.


3D XPoint architecture and attributes

The initial die or basic chip building block 3D XPoint implementation is a layer 128 Gbit device which if using 8 bits would yield 16GB raw. Over time increased densities should become available as the bit density improves with more cells and further scaling of the technology, combined with packaging. For example while a current die could hold up to 16 GBytes of data, multiple dies could be packaged together to create a 32GB, 64GB, 128GB etc. or larger actual product. Think about not only where packaged flash based SSD capacities are today, also think in terms of where DDR3 and DDR4 DIMM are at such as 4GB, 8GB, 16GB, 32GB densities.

The 3D aspect comes from the memory being in a matrix initially being two layers high, with multiple rows and columns that intersect, where those intersections occur is a microscopic material based switch for accessing a particular memory cell. Unlike NAND flash where an individual cell or bit is accessed as part of a larger block or page comprising several thousand bytes at once, 3D XPoint cells or bits can be individually accessed to speed up reads and writes in a more granular fashion. It is this more granular access along with performance that will enable 3D XPoint to be used in lower latency scenarios where DRAM would normally be used.

Instead of trapping electrons in a cell to create a bit of capacity (e.g. on or off) like NAND flash, 3D XPoint leverages the underlying physical material propertied to store a bit as a phase change enabling use of all cells. In other words, instead of being electron based, it is material based. While Intel and Micron did not specify what the actual chemistry and physical materials that are used in 3D XPoint, they did discuss some of the characteristics. If you want to go deep, check out how the Dailytech makes an interesting educated speculation or thesis on the underlying technology.

Watch the following video to get a better idea and visually see how 3D XPoint works.


3D XPoint YouTube Video

What are these chips, cells, wafers and dies?

Left many dies on a wafer, right, a closer look at the dies cut from the wafer

Dies (here and here) are the basic building block of what goes into the chips that in turn are the components used for creating DDR DIMM for main computer memory, as well as for create SD and MicroSD cards, USB thumb drives, PCIe AIC and drive form factor SSD, as well as custom modules on motherboards, or consumption via bare die and wafer level consumption (e.g. where you are doing really custom things at volume, beyond using a soldering iron scale).

Storage I/O trends

Has Intel and Micron cornered the NVM and memory market?

We have heard proclamations, speculation and statements of the demise of DRAM, NAND flash and other volatile and NVM memories for years, if not decades now. Each year there is the usual this will be the year of “x” where “x” can include among others. Resistive RAM aka ReRAM or RRAM aka the memristor that HP earlier announced they were going to bring to market and then earlier this year canceling those plans while Crossbar continues to pursue RRAM. MRAM or Magnetorestive RAM, Phase Change Memory aka CRAM or PCM and PRAM, FRAM aka FeRAM or Ferroelectric RAM among others.

flash SSD and NVM trends

Expanding persistent memory and SSD storage markets

Keep in mind that there are many steps taking time measured in years or decades to go from research and development lab idea to prototype that can then be produced at production volumes in economic yields. As a reference for, there is still plenty of life in both DRAM as well as NAND flash, the later having appeared around 1989.

Industry vs. Customer Adoption and deployment timeline

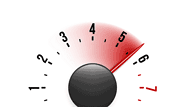
Technology industry adoption precedes customer adoption and deployment

There is a difference between industry adoption and deployment vs. customer adoption and deployment, they are related, yet separated by time as shown in the above figure. What this means is that there can be several years from the time a new technology is initially introduced and when it becomes generally available. Keep in mind that NAND flash has yet to reach its full market potential despite having made significant inroads the past few years since it was introduced in 1989.

This begs the question of if 3D XPoint is a variation of phase change, RRAM, MRAM or something else. Over at the Dailytech they lay out a line of thinking (or educated speculation) that 3D XPoint is some derivative or variation of phase change, time will tell about what it really is.

What’s the difference between 3D NAND flash and 3D XPoint?

3D NAND is a form of NAND flash NVM, while 3D XPoint is a completely new and different type of NVM (e.g. its not NAND).

3D NAND is a variation of traditional flash with the difference between vertical stacking vs. horizontal to improve density, also known as vertical NAND or V-NAND. Vertical stacking is like building up to house more tenants or occupants in a dense environment or scaling up, vs scaling-out by using up more space where density is not an issue. Note that magnetic HDD’s shifted to perpendicular (e.g. vertical) recording about ten years ago to break through the super parametric barrier and more recently, magnetic tape has also adopted perpendicular recording. Also keep in mind that 3D XPoint and the earlier announced Intel and Micron 3D NAND flash are two separate classes of memory that both just happen to have 3D in their marketing names.

Where to read, watch and learn more

Storage I/O trends

Additional learning experiences along with common questions (and answers), as well as tips can be found in Software Defined Data Infrastructure Essentials book.

Software Defined Data Infrastructure Essentials Book SDDC

What This All Means

First, keep in mind that this is very early in the 3D XPoint technology evolution life-cycle and both DRAM and NAND flash will not be dead at least near term. Keep in mind that NAND flash appeared back in 1989 and only over the past several years has finally hit its mainstream adoption stride with plenty of market upside left. Same with DRAM which has been around for sometime, it too still has plenty of life left for many applications. However other applications that have the need for improved speed over NAND flash, or persistency and density vs. DRAM will be some of the first to leverage new NVM technologies such as 3D XPoint. Thus at least for the next several years, there will be a co-existences between new and old NVM and DRAM among other memory technologies. Bottom line, 3D XPoint is a new class of NVM memory, can be used for persistent main server memory or for persistent fast storage memory. If you have not done so, check out Part I here and Part II here of this three-part series on Intel and Micron 3D XPoint.

Disclosure: Micron and Intel have been direct and/or indirect clients in the past via third-parties and partners, also I have bought and use some of their technologies direct and/or in-direct via their partners.

Ok, nuff said, for now.

Gs

Greg Schulz – Microsoft MVP Cloud and Data Center Management, VMware vExpert 2010-2017 (vSAN and vCloud). Author of Software Defined Data Infrastructure Essentials (CRC Press), as well as Cloud and Virtual Data Storage Networking (CRC Press), The Green and Virtual Data Center (CRC Press), Resilient Storage Networks (Elsevier) and twitter @storageio. Courteous comments are welcome for consideration. First published on https://storageioblog.com any reproduction in whole, in part, with changes to content, without source attribution under title or without permission is forbidden.

All Comments, (C) and (TM) belong to their owners/posters, Other content (C) Copyright 2006-2024 Server StorageIO and UnlimitedIO. All Rights Reserved. StorageIO is a registered Trade Mark (TM) of Server StorageIO.

Intel Micron unveil new 3D XPoint Non Volatie Memory NVM for servers storage

3D XPoint NVM persistent memory PM storage class memory SCM


Storage I/O trends

Updated 1/31/2018

This is the first of a three-part series on Intel Micron unveil new 3D XPoint Non Volatie Memory NVM for servers storage announcement. Read Part II here and Part III here.

In a webcast the other day, Intel and Micron announced new 3D XPoint non-volatile memory (NVM) that can be used for both primary main memory (e.g. what’s in computers, serves, laptops, tablets and many other things) in place of Dynamic Random Access Memory (DRAM), for persistent storage faster than today’s NAND flash-based solid state devices (SSD), not to mention future hybrid usage scenarios. Note that this announcement while having the common term 3D in it is different from the earlier Intel and Micron announcement about 3D NAND flash (read more about that here).

Twitter hash tag #3DXpoint

The big picture, why this type of NVM technology is needed

Server and Storage I/O trends

  • Memory is storage and storage is persistent memory
  • No such thing as a data or information recession, more data being create, processed and stored
  • Increased demand is also driving density along with convergence across server storage I/O resources
  • Larger amounts of data needing to be processed faster (large amounts of little data and big fast data)
  • Fast applications need more and faster processors, memory along with I/O interfaces
  • The best server or storage I/O is the one you do not need to do
  • The second best I/O is one with least impact or overhead
  • Data needs to be close to processing, processing needs to be close to the data (locality of reference)


Server Storage I/O memory hardware and software hierarchy along with technology tiers

What did Intel and Micron announce?

Intel SVP and General Manager Non-Volatile Memory solutions group Robert Crooke (Left) and Micron CEO D. Mark Durcan did the joint announcement presentation of 3D XPoint (webinar here). What was announced is the 3D XPoint technology jointly developed and manufactured by Intel and Micron which is a new form or category of NVM that can be used for both primary memory in servers, laptops, other computers among other uses, as well as for persistent data storage.


Robert Crooke (Left) and Mark Durcan (Right)

Summary of 3D XPoint announcement

  • New category of NVM memory for servers and storage
  • Joint development and manufacturing by Intel and Micron in Utah
  • Non volatile so can be used for storage or persistent server main memory
  • Allows NVM to scale with data, storage and processors performance
  • Leverages capabilities of both Intel and Micron who have collaborated in the past
  • Performance Intel and Micron claim up to 1000x faster vs. NAND flash
  • Availability persistent NVM compared to DRAM with better durability (life span) vs. NAND flash
  • Capacity densities about 10x better vs. traditional DRAM
  • Economics cost per bit between dram and nand (depending on packaging of resulting products)

What applications and products is 3D XPoint suited for?

In general, 3D XPoint should be able to be used for many of the same applications and associated products that current DRAM and NAND flash-based storage memories are used for. These range from IT and cloud or managed service provider data centers based applications and services, as well as consumer focused among many others.


3D XPoint enabling various applications

In general, applications or usage scenarios along with supporting products that can benefit from 3D XPoint include among others’. Applications that need larger amounts of main memory in a denser footprint such as in-memory databases, little and big data analytics, gaming, wave form analysis for security, copyright or other detection analysis, life sciences, high performance compute and high-productivity compute, energy, video and content severing among many others.

In addition, applications that need persistent main memory for resiliency, or to cut delays and impacts for planned or un-planned maintenance or having to wait for memories and caches to be warmed or re-populated after a server boot (or re-boot). 3D XPoint will also be useful for those applications that need faster read and write performance compared to current generations NAND flash for data storage. This means both existing and emerging applications as well as some that do not yet exist will benefit from 3D XPoint over time, like how today’s applications and others have benefited from DRAM used in Dual Inline Memory Module (DIMM) and NAND flash advances over the past several decades.

Where to read, watch and learn more

Storage I/O trends

Additional learning experiences along with common questions (and answers), as well as tips can be found in Software Defined Data Infrastructure Essentials book.

Software Defined Data Infrastructure Essentials Book SDDC

What This All Means

First, keep in mind that this is very early in the 3D XPoint technology evolution life-cycle and both DRAM and NAND flash will not be dead at least near term. Keep in mind that NAND flash appeared back in 1989 and only over the past several years has finally hit its mainstream adoption stride with plenty of market upside left. Continue reading Part II here and Part III here of this three-part series on Intel and Micron 3D XPoint along with more analysis and commentary.

Disclosure: Micron and Intel have been direct and/or indirect clients in the past via third-parties and partners, also I have bought and use some of their technologies direct and/or in-direct via their partners.

Ok, nuff said, for now.

Gs

Greg Schulz – Microsoft MVP Cloud and Data Center Management, VMware vExpert 2010-2017 (vSAN and vCloud). Author of Software Defined Data Infrastructure Essentials (CRC Press), as well as Cloud and Virtual Data Storage Networking (CRC Press), The Green and Virtual Data Center (CRC Press), Resilient Storage Networks (Elsevier) and twitter @storageio. Courteous comments are welcome for consideration. First published on https://storageioblog.com any reproduction in whole, in part, with changes to content, without source attribution under title or without permission is forbidden.

All Comments, (C) and (TM) belong to their owners/posters, Other content (C) Copyright 2006-2024 Server StorageIO and UnlimitedIO. All Rights Reserved. StorageIO is a registered Trade Mark (TM) of Server StorageIO.

How to test your HDD SSD or all flash array (AFA) storage fundamentals

How to test your HDD SSD AFA Hybrid or cloud storage

server storage data infrastructure i/o hdd ssd all flash array afa fundamentals

Updated 2/14/2018

Over at BizTech Magazine I have a new article 4 Ways to Performance Test Your New HDD or SSD that provides a quick guide to verifying or learning what the speed characteristic of your new storage device are capable of.

An out-take from the article used by BizTech as a "tease" is:

These four steps will help you evaluate new storage drives. And … psst … we included the metrics that matter.

Building off the basics, server storage I/O benchmark fundamentals

The four basic steps in the article are:

  • Plan what and how you are going to test (what’s applicable for you)
  • Decide on a benchmarking tool (learn about various tools here)
  • Test the test (find bugs, errors before a long running test)
  • Focus on metrics that matter (what’s important for your environment)

Server Storage I/O performance

Where To Learn More

View additional NAS, NVMe, SSD, NVM, SCM, Data Infrastructure and HDD related topics via the following links.

Additional learning experiences along with common questions (and answers), as well as tips can be found in Software Defined Data Infrastructure Essentials book.

Software Defined Data Infrastructure Essentials Book SDDC

What This All Means

To some the above (read the full article here) may seem like common sense tips and things everybody should know otoh there are many people who are new to servers storage I/O networking hardware software cloud virtual along with various applications, not to mention different tools.

Thus the above is a refresher for some (e.g. Dejavu) while for others it might be new and revolutionary or simply helpful. Interested in HDD’s, SSD’s as well as other server storage I/O performance along with benchmarking tools, techniques and trends check out the collection of links here (Server and Storage I/O Benchmarking and Performance Resources).

Ok, nuff said, for now.

Gs

Greg Schulz – Microsoft MVP Cloud and Data Center Management, VMware vExpert 2010-2017 (vSAN and vCloud). Author of Software Defined Data Infrastructure Essentials (CRC Press), as well as Cloud and Virtual Data Storage Networking (CRC Press), The Green and Virtual Data Center (CRC Press), Resilient Storage Networks (Elsevier) and twitter @storageio. Courteous comments are welcome for consideration. First published on https://storageioblog.com any reproduction in whole, in part, with changes to content, without source attribution under title or without permission is forbidden.

All Comments, (C) and (TM) belong to their owners/posters, Other content (C) Copyright 2006-2024 Server StorageIO and UnlimitedIO. All Rights Reserved. StorageIO is a registered Trade Mark (TM) of Server StorageIO.

I/O, I/O how well do you know good bad ugly server storage I/O iops?

How well do you know good bad ugly I/O iops?

server storage i/o iops activity data infrastructure trends

Updated 2/10/2018

There are many different types of server storage I/O iops associated with various environments, applications and workloads. Some I/Os activity are iops, others are transactions per second (TPS), files or messages per time (hour, minute, second), gets, puts or other operations. The best IO is one you do not have to do.

What about all the cloud, virtual, software defined and legacy based application that still need to do I/O?

If no IO operation is the best IO, then the second best IO is the one that can be done as close to the application and processor as possible with the best locality of reference.

Also keep in mind that aggregation (e.g. consolidation) can cause aggravation (server storage I/O performance bottlenecks).

aggregation causes aggravation
Example of aggregation (consolidation) causing aggravation (server storage i/o blender bottlenecks)

And the third best?

It’s the one that can be done in less time or at least cost or effect to the requesting application, which means moving further down the memory and storage stack.

solving server storage i/o blender and other bottlenecks
Leveraging flash SSD and cache technologies to find and fix server storage I/O bottlenecks

On the other hand, any IOP regardless of if for block, file or object storage that involves some context is better than those without, particular involving metrics that matter (here, here and here [webinar] )

Server Storage I/O optimization and effectiveness

The problem with IO’s is that they are a basic operations to get data into and out of a computer or processor, so there’s no way to avoid all of them, unless you have a very large budget. Even if you have a large budget that can afford an all flash SSD solution, you may still meet bottlenecks or other barriers.

IO’s require CPU or processor time and memory to set up and then process the results as well as IO and networking resources to move data too their destination or retrieve them from where they are stored. While IO’s cannot be eliminated, their impact can be greatly improved or optimized by, among other techniques, doing fewer of them via caching and by grouping reads or writes (pre-fetch, write-behind).

server storage I/O STI and SUT

Think of it this way: Instead of going on multiple errands, sometimes you can group multiple destinations together making for a shorter, more efficient trip. However, that optimization may also mean your drive will take longer. So, sometimes it makes sense to go on a couple of quick, short, low-latency trips instead of one larger one that takes half a day even as it accomplishes many tasks. Of course, how far you have to go on those trips (i.e., their locality) makes a difference about how many you can do in a given amount of time.

Locality of reference (or proximity)

What is locality of reference?

This refers to how close (i.e., its place) data exists to where it is needed (being referenced) for use. For example, the best locality of reference in a computer would be registers in the processor core, ready to be acted on immediately. This would be followed by levels 1, 2, and 3 (L1, L2, and L3) onboard caches, followed by main memory, or DRAM. After that comes solid-state memory typically NAND flash either on PCIe cards or accessible on a direct attached storage (DAS), SAN, or NAS device. 

server storage I/O locality of reference

Even though a PCIe NAND flash card is close to the processor, there still remains the overhead of traversing the PCIe bus and associated drivers. To help offset that impact, PCIe cards use DRAM as cache or buffers for data along with meta or control information to further optimize and improve locality of reference. In other words, this information is used to help with cache hits, cache use, and cache effectiveness vs. simply boosting cache use.

SSD to the rescue?

What can you do the cut the impact of IO’s?

There are many steps one can take, starting with establishing baseline performance and availability metrics.

The metrics that matter include IOP’s, latency, bandwidth, and availability. Then, leverage metrics to gain insight into your application’s performance.

Understand that IO’s are a fact of applications doing work (storing, retrieving, managing data) no matter whether systems are virtual, physical, or running up in the cloud. But it’s important to understand just what a bad IO is, along with its impact on performance. Try to identify those that are bad, and then find and fix the problem, either with software, application, or database changes. Perhaps you need to throw more software caching tools, hypervisors, or hardware at the problem. Hardware may include faster processors with more DRAM and faster internal busses.

Leveraging local PCIe flash SSD cards for caching or as targets is another option.

You may want to use storage systems or appliances that rely on intelligent caching and storage optimization capabilities to help with performance, availability, and capacity.

Where to gain insight into your server storage I/O environment

There are many tools that you can be used to gain insight into your server storage I/O environment across cloud, virtual, software defined and legacy as well as from different layers (e.g. applications, database, file systems, operating systems, hypervisors, server, storage, I/O networking). Many applications along with databases have either built-in or optional tools from their provider, third-party, or via other sources that can give information about work activity being done. Likewise there are tools to dig down deeper into the various data information infrastructure to see what is happening at the various layers as shown in the following figures.

application storage I/O performance
Gaining application and operating system level performance insight via different tools

windows and linux storage I/O performance
Insight and awareness via operating system tools on Windows and Linux

In the above example, Spotlight on Windows (SoW) which you can download for free from Dell here along with Ubuntu utilities are shown, You could also use other tools to look at server storage I/O performance including Windows Perfmon among others.

vmware server storage I/O
Hypervisor performance using VMware ESXi / vsphere built-in tools

vmware server storage I/O performance
Using Visual ESXtop to dig deeper into virtual server storage I/O performance

vmware server storage i/o cache
Gaining insight into virtual server storage I/O cache performance

Wrap up and summary

There are many approaches to address (e.g. find and fix) vs. simply move or mask data center and server storage I/O bottlenecks. Having insight and awareness into how your environment along with applications is important to know to focus resources. Also keep in mind that a bit of flash SSD or DRAM cache in the applicable place can go along way while a lot of cache will also cost you cash. Even if you cant eliminate I/Os, look for ways to decrease their impact on your applications and systems.

Where To Learn More

View additional NAS, NVMe, SSD, NVM, SCM, Data Infrastructure and HDD related topics via the following links.

Additional learning experiences along with common questions (and answers), as well as tips can be found in Software Defined Data Infrastructure Essentials book.

Software Defined Data Infrastructure Essentials Book SDDC

What This All Means

>Keep in mind: SSD including flash and DRAM among others are in your future, the question is where, when, with what, how much and whose technology or packaging.

Ok, nuff said, for now.

Gs

Greg Schulz – Microsoft MVP Cloud and Data Center Management, VMware vExpert 2010-2017 (vSAN and vCloud). Author of Software Defined Data Infrastructure Essentials (CRC Press), as well as Cloud and Virtual Data Storage Networking (CRC Press), The Green and Virtual Data Center (CRC Press), Resilient Storage Networks (Elsevier) and twitter @storageio. Courteous comments are welcome for consideration. First published on https://storageioblog.com any reproduction in whole, in part, with changes to content, without source attribution under title or without permission is forbidden.

All Comments, (C) and (TM) belong to their owners/posters, Other content (C) Copyright 2006-2024 Server StorageIO and UnlimitedIO. All Rights Reserved. StorageIO is a registered Trade Mark (TM) of Server StorageIO.

Revisiting RAID data protection remains relevant resource links

Revisiting RAID data protection remains relevant and resources

Storage I/O trends

Updated 2/10/2018

RAID data protection remains relevant including erasure codes (EC), local reconstruction codes (LRC) among other technologies. If RAID were really not relevant anymore (e.g. actually dead), why do some people spend so much time trying to convince others that it is dead or to use a different RAID level or enhanced RAID or beyond raid with related advanced approaches?

When you hear RAID, what comes to mind?

A legacy monolithic storage system that supports narrow 4, 5 or 6 drive wide stripe sets or a modern system support dozens of drives in a RAID group with different options?

RAID means many things, likewise there are different implementations (hardware, software, systems, adapters, operating systems) with various functionality, some better than others.

For example, which of the items in the following figure come to mind, or perhaps are new to your RAID vocabulary?

RAID questions

There are Many Variations of RAID Storage some for the enterprise, some for SMB, SOHO or consumer. Some have better performance than others, some have poor performance for example causing extra writes that lead to the perception that all parity based RAID do extra writes (some actually do write gathering and optimization).

Some hardware and software implementations using WBC (write back cache) mirrored or battery backed-BBU along with being able to group writes together in memory (cache) to do full stripe writes. The result can be fewer back-end writes compared to other systems. Hence, not all RAID implementations in either hardware or software are the same. Likewise, just because a RAID definition shows a particular theoretical implementation approach does not mean all vendors have implemented it in that way.

RAID is not a replacement for backup rather part of an overall approach to providing data availability and accessibility.

data protection and durability

What’s the best RAID level? The one that meets YOUR needs

There are different RAID levels and implementations (hardware, software, controller, storage system, operating system, adapter among others) for various environments (enterprise, SME, SMB, SOHO, consumer) supporting primary, secondary, tertiary (backup/data protection, archiving).

RAID comparison
General RAID comparisons

Thus one size or approach does fit all solutions, likewise RAID rules of thumbs or guides need context. Context means that a RAID rule or guide for consumer or SOHO or SMB might be different for enterprise and vise versa, not to mention on the type of storage system, number of drives, drive type and capacity among other factors.

RAID comparison
General basic RAID comparisons

Thus the best RAID level is the one that meets your specific needs in your environment. What is best for one environment and application may be different from what is applicable to your needs.

Key points and RAID considerations include:

· Not all RAID implementations are the same, some are very much alive and evolving while others are in need of a rest or rewrite. So it is not the technology or techniques that are often the problem, rather how it is implemented and then deployed.

· It may not be RAID that is dead, rather the solution that uses it, hence if you think a particular storage system, appliance, product or software is old and dead along with its RAID implementation, then just say that product or vendors solution is dead.

· RAID can be implemented in hardware controllers, adapters or storage systems and appliances as well as via software and those have different features, capabilities or constraints.

· Long or slow drive rebuilds are a reality with larger disk drives and parity-based approaches; however, you have options on how to balance performance, availability, capacity, and economics.

· RAID can be single, dual or multiple parity or mirroring-based.

· Erasure and other coding schemes leverage parity schemes and guess what umbrella parity schemes fall under.

· RAID may not be cool, sexy or a fun topic and technology to talk about, however many trendy tools, solutions and services actually use some form or variation of RAID as part of their basic building blocks. This is an example of using new and old things in new ways to help each other do more without increasing complexity.

·  Even if you are not a fan of RAID and think it is old and dead, at least take a few minutes to learn more about what it is that you do not like to update your dead FUD.

Wait, Isn’t RAID dead?

There is some dead marketing that paints a broad picture that RAID is dead to prop up something new, which in some cases may be a derivative variation of parity RAID.

data dispersal
Data dispersal and durability

RAID rebuild improving
RAID continues to evolve with rapid rebuilds for some systems

Otoh, there are some specific products, technologies, implementations that may be end of life or actually dead. Likewise what might be dead, dying or simply not in vogue are specific RAID implementations or packaging. Certainly there is a lot of buzz around object storage, cloud storage, forward error correction (FEC) and erasure coding including messages of how they cut RAID. Catch is that some object storage solutions are overlayed on top of lower level file systems that do things such as RAID 6, granted they are out of sight, out of mind.

RAID comparison
General RAID parity and erasure code/FEC comparisons

Then there are advanced parity protection schemes which include FEC and erasure codes that while they are not your traditional RAID levels, they have characteristic including chunking or sharding data, spreading it out over multiple devices with multiple parity (or derivatives of parity) protection.

Bottom line is that for some environments, different RAID levels may be more applicable and alive than for others.

Via BizTech – How to Turn Storage Networks into Better Performers

  • Maintain Situational Awareness
  • Design for Performance and Availability
  • Determine Networked Server and Storage Patterns
  • Make Use of Applicable Technologies and Techniques

If RAID is alive, what to do with it?

If you are new to RAID, learn more about the past, present and future keeping mind context. Keeping context in mind means that there are different RAID levels and implementations for various environments. Not all RAID 0, 1, 1/0, 10, 2, 3, 4, 5, 6 or other variations (past, present and emerging) are the same for consumer vs. SOHO vs. SMB vs. SME vs. Enterprise, nor are the usage cases. Some need performance for reads, others for writes, some for high-capacity with low performance using hardware or software. RAID Rules of thumb are ok and useful, however keep them in context to what you are doing as well as using.

What to do next?

Take some time to learn, ask questions including what to use when, where, why and how as well as if an approach or recommendation are applicable to your needs. Check out the following links to read some extra perspectives about RAID and keep in mind, what might apply to enterprise may not be relevant for consumer or SMB and vise versa.

Some advise needed on SSD’s and Raid (Via Spiceworks)
RAID 5 URE Rebuild Means The Sky Is Falling (Via BenchmarkReview)
Double drive failures in a RAID-10 configuration (Via SearchStorage)
Industry Trends and Perspectives: RAID Rebuild Rates (Via StorageIOblog)
RAID, IOPS and IO observations (Via StorageIOBlog)
RAID Relevance Revisited (Via StorageIOBlog)
HDDs Are Still Spinning (Rust Never Sleeps) (Via InfoStor)
When and Where to Use NAND Flash SSD for Virtual Servers (Via TheVirtualizationPractice)
What’s the best way to learn about RAID storage? (Via Spiceworks)
Design considerations for the host local FVP architecture (Via Frank Denneman)
Some basic RAID fundamentals and definitions (Via SearchStorage)
Can RAID extend nand flash SSD life? (Via StorageIOBlog)
I/O Performance Issues and Impacts on Time-Sensitive Applications (Via CMG)
The original RAID white paper (PDF) that while over 20 years old, it provides a basis, foundation and some history by Katz, Gibson, Patterson et al
Storage Interview Series (Via Infortrend)
Different RAID methods (Via RAID Recovery Guide)
A good RAID tutorial (Via TheGeekStuff)
Basics of RAID explained (Via ZDNet)
RAID and IOPs (Via VMware Communities)

Where To Learn More

View additional NAS, NVMe, SSD, NVM, SCM, Data Infrastructure and HDD related topics via the following links.

Additional learning experiences along with common questions (and answers), as well as tips can be found in Software Defined Data Infrastructure Essentials book.

Software Defined Data Infrastructure Essentials Book SDDC

What This All Means

What is my favorite or preferred RAID level?

That depends, for some things its RAID 1, for others RAID 10 yet for others RAID 4, 5, 6 or DP and yet other situations could be a fit for RAID 0 or erasure codes and FEC. Instead of being focused on just one or two RAID levels as the solution for different problems, I prefer to look at the environment (consumer, SOHO, small or large SMB, SME, enterprise), type of usage (primary or secondary or data protection), performance characteristics, reads, writes, type and number of drives among other factors. What might be a fit for one environment would not be a fit for others, thus my preferred RAID level along with where implemented is the one that meets the given situation. However also keep in mind is tying RAID into part of an overall data protection strategy, remember, RAID is not a replacement for backup.

What this all means

Like other technologies that have been declared dead for years or decades, aka the Zombie technologies (e.g. dead yet still alive) RAID continues to be used while the technologies evolves. There are specific products, implementations or even RAID levels that have faded away, or are declining in some environments, yet alive in others. RAID and its variations are still alive, however how it is used or deployed in conjunction with other technologies also is evolving.

Ok, nuff said, for now.

Gs

Greg Schulz – Microsoft MVP Cloud and Data Center Management, VMware vExpert 2010-2017 (vSAN and vCloud). Author of Software Defined Data Infrastructure Essentials (CRC Press), as well as Cloud and Virtual Data Storage Networking (CRC Press), The Green and Virtual Data Center (CRC Press), Resilient Storage Networks (Elsevier) and twitter @storageio. Courteous comments are welcome for consideration. First published on https://storageioblog.com any reproduction in whole, in part, with changes to content, without source attribution under title or without permission is forbidden.

All Comments, (C) and (TM) belong to their owners/posters, Other content (C) Copyright 2006-2024 Server StorageIO and UnlimitedIO. All Rights Reserved. StorageIO is a registered Trade Mark (TM) of Server StorageIO.

Server and Storage IO Memory: DRAM and nand flash

Storage I/O trends

DRAM, DIMM, DDR3, nand flash memory, SSD, stating what’s often assumed

Often what’s assumed is not always the case. For example in along with around server, storage and IO networking circles including virtual as well as cloud environments terms such as nand (Negated AND or NOT And) flash memory aka (Solid State Device or SSD), DRAM (Dynamic Random Access Memory), DDR3 (Double Data Rate 3) not to mention DIMM (Dual Inline Memory Module) get tossed around with the assumption everybody must know what they mean.

On the other hand, I find plenty of people who are not sure what those among other terms or things are, sometimes they are even embarrassed to ask, particular if they are a self-proclaimed expert.

So for those who need a refresh or primer, here you go, an excerpt from Chapter 7 (Servers – Physical, Virtual and Software) from my book "The Green and Virtual Data Center" (CRC Press) available at Amazon.com and other global venues in print and ebook formats.

7.2.2 Memory

Computers rely on some form of memory ranging from internal registers, local on-board processor Level 1 (L1) and Level 2 (L2) caches, random accessible memory (RAM), non-volatile RAM (NVRAM) or nand Flash (SSD) along with external disk storage. Memory, which includes external disk storage, is used for storing operating system software along with associated tools or utilities, application programs and data. Main memory or RAM, also known as dynamic RAM (DRAM) chips, is packaged in different ways with a common form being dual inline memory modules (DIMMs) for notebook or laptop, desktop PC and servers.

RAM main memory on a server is the fastest form of memory, second only to internal processor or chip based registers, L1, L2 or local memory. RAM and processor based memories are volatile and non-persistent in that when power is removed, the contents of memory are lost. As a result, some form of persistent memory is needed to keep programs and data when power is removed. Read only memory (ROM) and NVRAM are both persistent forms of memory in that their contents are not lost when power is removed. The amount of RAM that can be installed into a server will vary with specific architecture implementation and operating software being used. In addition to memory capacity and packaging format, the speed of memory is also important to be able to move data and programs quickly to avoid internal bottlenecks. Memory bandwidth performance increases with the width of the memory bus in bits and frequency in MHz. For example, moving 8 bytes on a 64 bit buss in parallel at the same time at 100MHz provides a theoretical 800MByte/sec speed.

To improve availability and increase the level of persistence, some servers include battery backed up RAM or cache to protect data in the event of a power loss. Another technique to protect memory data on some servers is memory mirroring where twice the amount of memory is installed and divided into two groups. Each group of memory has a copy of data being stored so that in the event of a memory failure beyond those correctable with standard parity and error correction code (ECC) no data is lost. In addition to being fast, RAM based memories are also more expensive and used in smaller quantities compared to external persistent memories such as magnetic hard disk drives, magnetic tape or optical based memory medias.

Memory diagram
Memory and Storage Pyramid

The above shows a tiered memory model that may look familiar as the bottom part is often expanded to show tiered storage. At the top of the memory pyramid is high-speed processor memory followed by RAM, ROM, NVRAM and FLASH along with many forms of external memory commonly called storage. More detail about tiered storage is covered in chapter 8 (Data Storage – Data Storage – Disk, Tape, Optical, and Memory). In addition to being slower and lower cost than RAM based memories, disk storage along with NVRAM and FLASH based memory devices are also persistent.

By being persistent, when power is removed, data is retained on the storage or memory device. Also shown in the above figure is that on a relative basis, less energy is used for power storage or memory at the bottom of the pyramid than for upper levels where performance increases. From a PCFE (Power, Cooling, Floor space, Economic) perspective, balancing memory and storage performance, availability, capacity and energy to a given function, quality of service and service level objective for a given cost needs to be kept in perspective and not considering simply the lowest cost for the most amount of memory or storage. In addition to gauging memory on capacity, other metrics include percent used, operating system page faults and page read/write operations along with memory swap activity as well memory errors.

Base 2 versus base 10 numbering systems can account for some storage capacity that appears to “missing” when real storage is compared to what is expected to be seen. Disk drive manufacturers use base 10 (decimal) to count bytes of data while memory chip, server and operating system vendors typically use base 2 (binary) to count bytes of data. This has led to confusion when comparing a disk drive base 10 GB with a chip memory base 2 GB of memory capacity, such as 1,000,000,000 (10^9) bytes versus 1,073,741,824 (2^30) bytes. Nomenclature based on the International System of Units uses MiB, GiB and TiB to denote million, billion and trillion bytes for base 2 numbering with base 10 using MB, TB and GB . Most vendors do document how many bytes, sometimes in both base 2 and base 10, as well as the number of 512 byte sectors supported on their storage devices and storage systems, though it might be in the small print.

Related more reading:
How much storage performance do you want vs. need?
Can RAID extend the life of nand flash SSD?
Can we get a side of context with them IOPS and other storage metrics?
SSD & Real Estate: Location, Location, Location
What is the best kind of IO? The one you do not have to do
SSD, flash and DRAM, DejaVu or something new?

Ok, nuff said (for now).

Cheers
Gs

Greg Schulz – Author Cloud and Virtual Data Storage Networking (CRC Press), The Green and Virtual Data Center (CRC Press) and Resilient Storage Networks (Elsevier).

All Comments, (C) and (TM) belong to their owners/posters, Other content (C) Copyright 2006-2024 Server StorageIO and UnlimitedIO LLC All Rights Reserved

Can we get a side of context with them IOPS server storage metrics?

Can we get a side of context with them server storage metrics?

Storage I/O trends

Updated 2/10/2018

Whats the best server storage I/O network metric or benchmark? It depends as there needs to be some context with them IOPS and other server storage I/O metrics that matter.

There is an old saying that the best I/O (Input/Output) is the one that you do not have to do.

In the meantime, let’s get a side of some context with them IOPS from vendors, marketers and their pundits who are tossing them around for server, storage and IO metrics that matter.

Expanding the conversation, the need for more context

The good news is that people are beginning to discuss storage beyond space capacity and cost per GByte, TByte or PByte for both DRAM or nand flash Solid State Devices (SSD), Hard Disk Drives (HDD) along with Hybrid HDD (HHDD) and Solid State Hybrid Drive (SSHD) based solutions. This applies to traditional enterprise or SMB IT data center with physical, virtual or cloud based infrastructures.

hdd and ssd iops

This is good because it expands the conversation beyond just cost for space capacity into other aspects including performance (IOPS, latency, bandwidth) for various workload scenarios along with availability, energy effective and management.

Adding a side of context

The catch is that IOPS while part of the equation are just one aspect of performance and by themselves without context, may have little meaning if not misleading in some situations.

Granted it can be entertaining, fun to talk about or simply make good press copy for a million IOPS. IOPS vary in size depending on the type of work being done, not to mention reads or writes, random and sequential which also have a bearing on data throughout or bandwidth (Mbytes per second) along with response time.

However, are those million IOP’s applicable to your environment or needs?

Likewise, what do those million or more IOPS represent about type of work being done? For example, are they small 64 byte or large 64 Kbyte sized, random or sequential, cached reads or lazy writes (deferred or buffered) on a SSD or HDD?

How about the response time or latency for achieving them IOPS?

In other words, what is the context of those metrics and why do they matter?

storage i/o iops
Click on image to view more metrics that matter including IOP’s for HDD and SSD’s

Metrics that matter give context for example IO sizes closer to what your real needs are, reads and writes, mixed workloads, random or sequential, sustained or bursty, in other words, real world reflective.

As with any benchmark take them with a grain (or more) of salt, they key is use them as an indicator then align to your needs. The tool or technology should work for you, not the other way around.

Here are some examples of context that can be added to help make IOP’s and other metrics matter:

  • What is the IOP size, are they 512 byte (or smaller) vs. 4K bytes (or larger)?
  • Are they reads, writes, random, sequential or mixed and what percentage?
  • How was the storage configured including RAID, replication, erasure or dispersal codes?
  • Then there is the latency or response time and IO queue depths for the given number of IOPS.
  • Let us not forget if the storage systems (and servers) were busy with other work or not.
  • If there is a cost per IOP, is that list price or discount (hint, if discount start negotiations from there)
  • What was the number of threads or workers, along with how many servers?
  • What tool was used, its configuration, as well as raw or cooked (aka file system) IO?
  • Was the IOP’s number with one worker or multiple workers on a single or multiple servers?
  • Did the IOP’s number come from a single storage system or total of multiple systems?
  • Fast storage needs fast serves and networks, what was their configuration?
  • Was the performance a short burst, or long sustained period?
  • What was the size of the test data used; did it all fit into cache?
  • Were short stroking for IOPS or long stroking for bandwidth techniques used?
  • Data footprint reduction (DFR) techniques (thin provisioned, compression or dedupe) used?
  • Were write data committed synchronously to storage, or deferred (aka lazy writes used)?

The above are just a sampling and not all may be relevant to your particular needs, however they help to put IOP’s into more contexts. Another consideration around IOPS are the configuration of the environment, from an actual running application using some measurement tool, or are they generated from a workload tool such as IOmeter, IOrate, VDbench among others.

Sure, there are more contexts and information that would be interesting as well, however learning to walk before running will help prevent falling down.

Storage I/O trends

Does size or age of vendors make a difference when it comes to context?

Some vendors are doing a good job of going for out of this world record-setting marketing hero numbers.

Meanwhile other vendors are doing a good job of adding context to their IOP or response time or bandwidth among other metrics that matter. There is a mix of startup and established that give context with their IOP’s or other metrics, likewise size or age does not seem to matter for those who lack context.

Some vendors may not offer metrics or information publicly, so fine, go under NDA to learn more and see if the results are applicable to your environments.

Likewise, if they do not want to provide the context, then ask some tough yet fair questions to decide if their solution is applicable for your needs.

Storage I/O trends

Where To Learn More

View additional NAS, NVMe, SSD, NVM, SCM, Data Infrastructure and HDD related topics via the following links.

Additional learning experiences along with common questions (and answers), as well as tips can be found in Software Defined Data Infrastructure Essentials book.

Software Defined Data Infrastructure Essentials Book SDDC

What This All Means

What this means is let us start putting and asking for metrics that matter such as IOP’s with context.

If you have a great IOP metric, if you want it to matter than include some context such as what size (e.g. 4K, 8K, 16K, 32K, etc.), percentage of reads vs. writes, latency or response time, random or sequential.

IMHO the most interesting or applicable metrics that matter are those relevant to your environment and application. For example if your main application that needs SSD does about 75% reads (random) and 25% writes (sequential) with an average size of 32K, while fun to hear about, how relevant is a million 64 byte read IOPS? Likewise when looking at IOPS, pay attention to the latency, particular if SSD or performance is your main concern.

Get in the habit of asking or telling vendors or their surrogates to provide some context with them metrics if you want them to matter.

So how about some context around them IOP’s (or latency and bandwidth or availability for that matter)?

Ok, nuff said, for now.

Gs

Greg Schulz – Microsoft MVP Cloud and Data Center Management, VMware vExpert 2010-2017 (vSAN and vCloud). Author of Software Defined Data Infrastructure Essentials (CRC Press), as well as Cloud and Virtual Data Storage Networking (CRC Press), The Green and Virtual Data Center (CRC Press), Resilient Storage Networks (Elsevier) and twitter @storageio. Courteous comments are welcome for consideration. First published on https://storageioblog.com any reproduction in whole, in part, with changes to content, without source attribution under title or without permission is forbidden.

All Comments, (C) and (TM) belong to their owners/posters, Other content (C) Copyright 2006-2024 Server StorageIO and UnlimitedIO. All Rights Reserved. StorageIO is a registered Trade Mark (TM) of Server StorageIO.

Part II: How many IOPS can a HDD HHDD SSD do with VMware?

How many IOPS can a HDD HHDD SSD do with VMware?

server storage data infrastructure i/o iop hdd ssd trends

Updated 2/10/2018

This is the second post of a two-part series looking at storage performance, specifically in the context of drive or device (e.g. mediums) characteristics of How many IOPS can a HDD HHDD SSD do with VMware. In the first post the focus was around putting some context around drive or device performance with the second part looking at some workload characteristics (e.g. benchmarks).

A common question is how many IOPS (IO Operations Per Second) can a storage device or system do?

The answer is or should be it depends.

Here are some examples to give you some more insight.

For example, the following shows how IOPS vary by changing the percent of reads, writes, random and sequential for a 4K (4,096 bytes or 4 KBytes) IO size with each test step (4 minutes each).

IO Size for test
Workload Pattern of test
Avg. Resp (R+W) ms
Avg. IOP Sec (R+W)
Bandwidth KB Sec (R+W)
4KB
100% Seq 100% Read
0.0
29,736
118,944
4KB
60% Seq 100% Read
4.2
236
947
4KB
30% Seq 100% Read
7.1
140
563
4KB
0% Seq 100% Read
10.0
100
400
4KB
100% Seq 60% Read
3.4
293
1,174
4KB
60% Seq 60% Read
7.2
138
554
4KB
30% Seq 60% Read
9.1
109
439
4KB
0% Seq 60% Read
10.9
91
366
4KB
100% Seq 30% Read
5.9
168
675
4KB
60% Seq 30% Read
9.1
109
439
4KB
30% Seq 30% Read
10.7
93
373
4KB
0% Seq 30% Read
11.5
86
346
4KB
100% Seq 0% Read
8.4
118
474
4KB
60% Seq 0% Read
13.0
76
307
4KB
30% Seq 0% Read
11.6
86
344
4KB
0% Seq 0% Read
12.1
82
330

Dell/Western Digital (WD) 1TB 7200 RPM SATA HDD (Raw IO) thread count 1 4K IO size

In the above example the drive is a 1TB 7200 RPM 3.5 inch Dell (Western Digital) 3Gb SATA device doing raw (non file system) IO. Note the high IOP rate with 100 percent sequential reads and a small IO size which might be a result of locality of reference due to drive level cache or buffering.

Some drives have larger buffers than others from a couple to 16MB (or more) of DRAM that can be used for read ahead caching. Note that this level of cache is independent of a storage system, RAID adapter or controller or other forms and levels of buffering.

Does this mean you can expect or plan on getting those levels of performance?

I would not make that assumption, and thus this serves as an example of using metrics like these in the proper context.

Building off of the previous example, the following is using the same drive however with a 16K IO size.

IO Size for test
Workload Pattern of test
Avg. Resp (R+W) ms
Avg. IOP Sec (R+W)
Bandwidth KB Sec (R+W)
16KB
100% Seq 100% Read
0.1
7,658
122,537
16KB
60% Seq 100% Read
4.7
210
3,370
16KB
30% Seq 100% Read
7.7
130
2,080
16KB
0% Seq 100% Read
10.1
98
1,580
16KB
100% Seq 60% Read
3.5
282
4,522
16KB
60% Seq 60% Read
7.7
130
2,090
16KB
30% Seq 60% Read
9.3
107
1,715
16KB
0% Seq 60% Read
11.1
90
1,443
16KB
100% Seq 30% Read
6.0
165
2,644
16KB
60% Seq 30% Read
9.2
109
1,745
16KB
30% Seq 30% Read
11.0
90
1,450
16KB
0% Seq 30% Read
11.7
85
1,364
16KB
100% Seq 0% Read
8.5
117
1,874
16KB
60% Seq 0% Read
10.9
92
1,472
16KB
30% Seq 0% Read
11.8
84
1,353
16KB
0% Seq 0% Read
12.2
81
1,310

Dell/Western Digital (WD) 1TB 7200 RPM SATA HDD (Raw IO) thread count 1 16K IO size

The previous two examples are excerpts of a series of workload simulation tests (ok, you can call them benchmarks) that I have done to collect information, as well as try some different things out.

The following is an example of the summary for each test output that includes the IO size, workload pattern (reads, writes, random, sequential), duration for each workload step, totals for reads and writes, along with averages including IOP’s, bandwidth and latency or response time.

disk iops

Want to see more numbers, speeds and feeds, check out the following table which will be updated with extra results as they become available.

Device
Vendor
Make

Model

Form Factor
Capacity
Interface
RPM Speed
Raw
Test Result
HDD
HGST
Desktop
HK250-160
2.5
160GB
SATA
5.4K
HDD
Seagate
Mobile
ST2000LM003
2.5
2TB
SATA
5.4K
HDD
Fujitsu
Desktop
MHWZ160BH
2.5
160GB
SATA
7.2K
HDD
Seagate
Momentus
ST9160823AS
2.5
160GB
SATA
7.2K
HDD
Seagate
MomentusXT
ST95005620AS
2.5
500GB
SATA
7.2K(1)
HDD
Seagate
Barracuda
ST3500320AS
3.5
500GB
SATA
7.2K
HDD
WD/Dell
Enterprise
WD1003FBYX
3.5
1TB
SATA
7.2K
HDD
Seagate
Barracuda
ST3000DM01
3.5
3TB
SATA
7.2K
HDD
Seagate
Desktop
ST4000DM000
3.5
4TB
SATA
HDD
HDD
Seagate
Capacity
ST6000NM00
3.5
6TB
SATA
HDD
HDD
Seagate
Capacity
ST6000NM00
3.5
6TB
12GSAS
HDD
HDD
Seagate
Savio 10K.3
ST9300603SS
2.5
300GB
SAS
10K
HDD
Seagate
Cheetah
ST3146855SS
3.5
146GB
SAS
15K
HDD
Seagate
Savio 15K.2
ST9146852SS
2.5
146GB
SAS
15K
HDD
Seagate
Ent. 15K
ST600MP0003
2.5
600GB
SAS
15K
SSHD
Seagate
Ent. Turbo
ST600MX0004
2.5
600GB
SAS
SSHD
SSD
Samsung
840 PRo
MZ-7PD256
2.5
256GB
SATA
SSD
HDD
Seagate
600 SSD
ST480HM000
2.5
480GB
SATA
SSD
SSD
Seagate
1200 SSD
ST400FM0073
2.5
400GB
12GSAS
SSD

Performance characteristics 1 worker (thread count) for RAW IO (non-file system)

Note: (1) Seagate Momentus XT is a Hybrid Hard Disk Drive (HHDD) based on a 7.2K 2.5 HDD with SLC nand flash integrated for read buffer in addition to normal DRAM buffer. This model is a XT I (4GB SLC nand flash), may add an XT II (8GB SLC nand flash) at some future time.

As a starting point, these results are raw IO with file system based information to be added soon along with more devices. These results are for tests with one worker or thread count, other results will be added with such as 16 workers or thread counts to show how those differ.

The above results include all reads, all writes, mix of reads and writes, along with all random, sequential and mixed for each IO size. IO sizes include 4K, 8K, 16K, 32K, 64K, 128K, 256K, 512K, 1024K and 2048K. As with any workload simulation, benchmark or comparison test, take these results with a grain of salt as your mileage can and will vary. For example you will see some what I consider very high IO rates with sequential reads even without file system buffering. These results might be due to locality of reference of IO’s being resolved out of the drives DRAM cache (read ahead) which vary in size for different devices. Use the vendor model numbers in the table above to check the manufactures specs on drive DRAM and other attributes.

If you are used to seeing 4K or 8K and wonder why anybody would be interested in some of the larger sizes take a look at big fast data or cloud and object storage. For some of those applications 2048K may not seem all that big. Likewise if you are used to the larger sizes, there are still applications doing smaller sizes. Sorry for those who like 512 byte or smaller IO’s as they are not included. Note that for all of these unless indicated a 512 byte standard sector or drive format is used as opposed to emerging Advanced Format (AF) 4KB sector or block size. Watch for some more drive and device types to be added to the above, along with results for more workers or thread counts, along with file system and other scenarios.

Using VMware as part of a Server, Storage and IO (aka StorageIO) test platform

vmware vexpert

The above performance results were generated on Ubuntu 12.04 (since upgraded to 14.04 which was hosted on a VMware vSphere 5.1 (upgraded to 5.5U2) purchased version (you can get the ESXi free version here) with vCenter enabled system. I also have VMware workstation installed on some of my Windows-based laptops for doing preliminary testing of scripts and other activity prior to running them on the larger server-based VMware environment. Other VMware tools include vCenter Converter, vSphere Client and CLI. Note that other guest virtual machines (VMs) were idle during the tests (e.g. other guest VMs were quiet). You may experience different results if you ran Ubuntu native on a physical machine or with different adapters, processors and device configurations among many other variables (that was a disclaimer btw ;) ).

Storage I/O trends

All of the devices (HDD, HHDD, SSD’s including those not shown or published yet) were Raw Device Mapped (RDM) to the Ubuntu VM bypassing VMware file system.

Example of creating an RDM for local SAS or SATA direct attached device.

vmkfstools -z /vmfs/devices/disks/naa.600605b0005f125018e923064cc17e7c /vmfs/volumes/dat1/RDM_ST1500Z110S6M5.vmdk

The above uses the drives address (find by doing a ls -l /dev/disks via VMware shell command line) to then create a vmdk container stored in a dat. Note that the RDM being created does not actually store data in the .vmdk, it’s there for VMware management operations.

If you are not familiar with how to create a RDM of a local SAS or SATA device, check out this post to learn how.This is important to note in that while VMware was used as a platform to support the guest operating systems (e.g. Ubuntu or Windows), the real devices are not being mapped through or via VMware virtual drives.

vmware iops

The above shows examples of RDM SAS and SATA devices along with other VMware devices and dats. In the next figure is an example of a workload being run in the test environment.

vmware iops

One of the advantages of using VMware (or other hypervisor) with RDM’s is that I can quickly define via software commands where a device gets attached to different operating systems (e.g. the other aspect of software defined storage). This means that after a test run, I can quickly simply shutdown Ubuntu, remove the RDM device from that guests settings, move the device just tested to a Windows guest if needed and restart those VMs. All of that from where ever I happen to be working from without physically changing things or dealing with multi-boot or cabling issues.

Where To Learn More

View additional NAS, NVMe, SSD, NVM, SCM, Data Infrastructure and HDD related topics via the following links.

Additional learning experiences along with common questions (and answers), as well as tips can be found in Software Defined Data Infrastructure Essentials book.

Software Defined Data Infrastructure Essentials Book SDDC

What This All Means

So how many IOPs can a device do?

That depends, however have a look at the above information and results.

Check back from time to time here to see what is new or has been added including more drives, devices and other related themes.

Ok, nuff said, for now.

Gs

Greg Schulz – Microsoft MVP Cloud and Data Center Management, VMware vExpert 2010-2017 (vSAN and vCloud). Author of Software Defined Data Infrastructure Essentials (CRC Press), as well as Cloud and Virtual Data Storage Networking (CRC Press), The Green and Virtual Data Center (CRC Press), Resilient Storage Networks (Elsevier) and twitter @storageio. Courteous comments are welcome for consideration. First published on https://storageioblog.com any reproduction in whole, in part, with changes to content, without source attribution under title or without permission is forbidden.

All Comments, (C) and (TM) belong to their owners/posters, Other content (C) Copyright 2006-2024 Server StorageIO and UnlimitedIO. All Rights Reserved. StorageIO is a registered Trade Mark (TM) of Server StorageIO.

How many I/O iops can flash SSD or HDD do?

How many i/o iops can flash ssd or hdd do with vmware?

sddc data infrastructure Storage I/O ssd trends

Updated 2/10/2018

A common question I run across is how many I/O iopsS can flash SSD or HDD storage device or system do or give.

The answer is or should be it depends.

This is the first of a two-part series looking at storage performance, and in context specifically around drive or device (e.g. mediums) characteristics across HDD, HHDD and SSD that can be found in cloud, virtual, and legacy environments. In this first part the focus is around putting some context around drive or device performance with the second part looking at some workload characteristics (e.g. benchmarks).

What about cloud, tape summit resources, storage systems or appliance?

Lets leave those for a different discussion at another time.

Getting started

Part of my interest in tools, metrics that matter, measurements, analyst, forecasting ties back to having been a server, storage and IO performance and capacity planning analyst when I worked in IT. Another aspect ties back to also having been a sys admin as well as business applications developer when on the IT customer side of things. This was followed by switching over to the vendor world involved with among other things competitive positioning, customer design configuration, validation, simulation and benchmarking HDD and SSD based solutions (e.g. life before becoming an analyst and advisory consultant).

Btw, if you happen to be interested in learn more about server, storage and IO performance and capacity planning, check out my first book Resilient Storage Networks (Elsevier) that has a bit of information on it. There is also coverage of metrics and planning in my two other books The Green and Virtual Data Center (CRC Press) and Cloud and Virtual Data Storage Networking (CRC Press). I have some copies of Resilient Storage Networks available at a special reader or viewer rate (essentially shipping and handling). If interested drop me a note and can fill you in on the details.

There are many rules of thumb (RUT) when it comes to metrics that matter such as IOPS, some that are older while others may be guess or measured in different ways. However the answer is that it depends on many things ranging from if a standalone hard disk drive (HDD), Hybrid HDD (HHDD), Solid State Device (SSD) or if attached to a storage system, appliance, or RAID adapter card among others.

Taking a step back, the big picture

hdd image
Various HDD, HHDD and SSD’s

Server, storage and I/O performance and benchmark fundamentals

Even if just looking at a HDD, there are many variables ranging from the rotational speed or Revolutions Per Minute (RPM), interface including 1.5Gb, 3.0Gb, 6Gb or 12Gb SAS or SATA or 4Gb Fibre Channel. If simply using a RUT or number based on RPM can cause issues particular with 2.5 vs. 3.5 or enterprise and desktop. For example, some current generation 10K 2.5 HDD can deliver the same or better performance than an older generation 3.5 15K. Other drive factors (see this link for HDD fundamentals) including physical size such as 3.5 inch or 2.5 inch small form factor (SFF), enterprise or desktop or consumer, amount of drive level cache (DRAM). Space capacity of a drive can also have an impact such as if all or just a portion of a large or small capacity devices is used. Not to mention what the drive is attached to ranging from in internal SAS or SATA drive bay, USB port, or a HBA or RAID adapter card or in a storage system.

disk iops
HDD fundamentals

How about benchmark and performance for marketing or comparison tricks including delayed, deferred or asynchronous writes vs. synchronous or actually committed data to devices? Lets not forget about short stroking (only using a portion of a drive for better IOP’s) or even long stroking (to get better bandwidth leveraging spiral transfers) among others.

Almost forgot, there are also thick, standard, thin and ultra thin drives in 2.5 and 3.5 inch form factors. What’s the difference? The number of platters and read write heads. Look at the following image showing various thickness 2.5 inch drives that have various numbers of platters to increase space capacity in a given density. Want to take a wild guess as to which one has the most space capacity in a given footprint? Also want to guess which type I use for removable disk based archives along with for onsite disk based backup targets (compliments my offsite cloud backups)?

types of disks
Thick, thin and ultra thin devices

Beyond physical and configuration items, then there are logical configuration including the type of workload, large or small IOPS, random, sequential, reads, writes or mixed (various random, sequential, read, write, large and small IO). Other considerations include file system or raw device, number of workers or concurrent IO threads, size of the target storage space area to decide impact of any locality of reference or buffering. Some other items include how long the test or workload simulation ran for, was the device new or worn in before use among other items.

Tools and the performance toolbox

Then there are the various tools for generating IO’s or workloads along with recording metrics such as reads, writes, response time and other information. Some examples (mix of free or for fee) include Bonnie, Iometer, Iorate, IOzone, Vdbench, TPC, SPC, Microsoft ESRP, SPEC and netmist, Swifttest, Vmark, DVDstore and PCmark 7 among many others. Some are focused just on the storage system and IO path while others are application specific thus exercising servers, storage and IO paths.

performance tools
Server, storage and IO performance toolbox

Having used Iometer since the late 90s, it has its place and is popular given its ease of use. Iometer is also long in the tooth and has its limits including not much if any new development, never the less, I have it in the toolbox. I also have Futremark PCmark 7 (full version) which turns out has some interesting abilities to do more than exercise an entire Windows PC. For example PCmark can use a secondary drive for doing IO to.

PCmark can be handy for spinning up with VMware (or other tools) lots of virtual Windows systems pointing to a NAS or other shared storage device doing real world type activity. Something that could be handy for testing or stressing virtual desktop infrastructures (VDI) along with other storage systems, servers and solutions. I also have Vdbench among others tools in the toolbox including Iorate which was used to drive the workloads shown below.

What I look for in a tool are how extensible are the scripting capabilities to define various workloads along with capabilities of the test engine. A nice GUI is handy which makes Iometer popular and yes there are script capabilities with Iometer. That is also where Iometer is long in the tooth compared to some of the newer generation of tools that have more emphasis on extensibility vs. ease of use interfaces. This also assumes knowing what workloads to generate vs. simply kicking off some IOPs using default settings to see what happens.

Another handy tool is for recording what’s going on with a running system including IO’s, reads, writes, bandwidth or transfers, random and sequential among other things. This is where when needed I turn to something like HiMon from HyperIO, if you have not tried it, get in touch with Tom West over at HyperIO and tell him StorageIO sent you to get a demo or trial. HiMon is what I used for doing start, stop and boot among other testing being able to see IO’s at the Windows file system level (or below) including very early in the boot or shutdown phase.

Here is a link to some other things I did awhile back with HiMon to profile some Windows and VDI activity test profiling.

What’s the best tool or benchmark or workload generator?

The one that meets your needs, usually your applications or something as close as possible to it.

disk iops
Various 2.5 and 3.5 inch HDD, HHDD, SSD with different performance

Where To Learn More

View additional NAS, NVMe, SSD, NVM, SCM, Data Infrastructure and HDD related topics via the following links.

Additional learning experiences along with common questions (and answers), as well as tips can be found in Software Defined Data Infrastructure Essentials book.

Software Defined Data Infrastructure Essentials Book SDDC

What This All Means

That depends, however continue reading part II of this series to see some results for various types of drives and workloads.

Ok, nuff said, for now.

Gs

Greg Schulz – Microsoft MVP Cloud and Data Center Management, VMware vExpert 2010-2017 (vSAN and vCloud). Author of Software Defined Data Infrastructure Essentials (CRC Press), as well as Cloud and Virtual Data Storage Networking (CRC Press), The Green and Virtual Data Center (CRC Press), Resilient Storage Networks (Elsevier) and twitter @storageio. Courteous comments are welcome for consideration. First published on https://storageioblog.com any reproduction in whole, in part, with changes to content, without source attribution under title or without permission is forbidden.

All Comments, (C) and (TM) belong to their owners/posters, Other content (C) Copyright 2006-2024 Server StorageIO and UnlimitedIO. All Rights Reserved. StorageIO is a registered Trade Mark (TM) of Server StorageIO.

Trick or treat and vendor fun games

Server StorageIO data infrastructure industry trends Trick or treat and vendor fun games
Trick or treat and vendor fun games
Updated 6/26/18

In the spirit of Halloween and zombies season, a couple of thoughts come to mind about vendor tricks and treats. This is an industry trends and perspectives post, part of an ongoing series looking at various technology and fun topics.

The first trick or treat game pertains to the blame game; you know either when something breaks, or at the other extreme, before you have even made a decision to buy something. The trick or treat game for decision-making goes something like this.

StorageIO industry trends cloud, virtualization and big data

Vendor “A” says products succeed with their solution while failure results with a solution from “B” when doing “X”. Otoh, vendor “B” claims that “X” will fail when using a solution from vendor “A”. In fact, you can pick what you want to substitute for “X”, perhaps VDI, Big Data, Little Data, Backup, Archive, Analytics, Private Cloud, Public Cloud, Hybrid Cloud, eDiscovery you name it.

This is not complicated math or big data problem requiring a high-performance computing (HPC) platform. A HPC Zetta-Flop processing ability using 512 bit addressing of 9.9 (e.g. 1 nine) PettaBytes of battery-backed DRAM and an IO capability of 9.99999 (e.g. 5 9’s) trillion 8 bit IOPS to do table pivots or runge kutta numerical analysis, map reduce, SAS or another modeling with optional iProduct or Android interface are not needed.

image of StorageIO big data HPC cloud storageimage of StorageIO big data HPC cloud storage
StorageIO images of touring Texas Advanced Computing (e.g. HPC) Center

Can you solve this equation? Hint it does not need a PhD or any other advanced degree. Another hint, if you have ever been at any side of the technology product and services decision-making table, regardless of the costume you wore, you should know the answer.

Of course the question of would “X” fail regardless of who or what “A” or “B” let alone a “C”, “D” or “F”? In other words, it is not the solution, technology, vendor or provider, rather the problem or perhaps even lack thereof that is the issue. Or is it a case where there is a solution from “A”, “B” or any others that is looking for a problem, and if it is the wrong problem, there can be a wrong solution thus failure?

StorageIO industry trends cloud, virtualization and big data

Another trick or treat game is vendors public relations (PR) or analyst relations (AR) people to ask for one thing and delivery or ask another. For example, some vendor, service provider, their marketing AR and PR people or surrogates make contact wanting to tell of various success and failure story. Of course, this is usually their success and somebody else’s failure, or their victory over something or someone who sometimes can be interesting. Of course, there are also the treats to get you to listen to the above, such as tempt you with a project if you meet with their subject, which may be a trick of a disappearing treat (e.g. magic, poof it is gone after the discussion).

There are another AR and PR trick and treat where they offer on behalf of their representative organization or client to a perspective or exclusive insight on their competitor. Of course, the treat from their perspective is that they will generously expose all that is wrong with what a competitor is saying about their own (e.g. the competitors) product.

StorageIO industry trends cloud, virtualization and big data

Let me get this straight, I am not supposed to believe what somebody says about his or her own product, however, supposed to believe what a competitor says is wrong with the competition’s product, and what is right with his or her own product.

Hmm, ok, so let me get this straight, a competitor say “A” wants to tell me what somebody say from “B” has told me is wrong and I should schedule a visit with a truth squad member from “A” to get the record set straight about “B”?

Does that mean then that I go to “B” for a rebuttal, as well as an update about “A” from “B”, assuming that what “A” has told me is also false about themselves, and perhaps about “B” or any other?

Too be fair, depending on your level of trust and confidence in either a vendor, their personal or surrogates, you might tend to believe more from them vs. others, or at least until you been tricked after given treats. There may be some that have been tricked, or they tried applying to many treats to present a story that behind the costume might be a bit scary.

StorageIO industry trends cloud, virtualization and big data

Having been through enough of these, and I candidly believe that sometimes “A” or “B” or any other party actually do believe that they have more or better info about their competitor and that they can convince somebody about what their competitor is doing better than the competitor can. I also believe that there are people out there who will go to “A” or “B” and believe what they are told by based on their preference, bias or interests.

When I hear from vendors, VARs, solution or service providers and others, it’s interesting hearing point, counterpoint and so forth, however if time is limited, I’am more interested in hearing from such as “A” about them, what they are doing, where success, where challenges, where going and if applicable, under NDA go into more detail.

StorageIO industry trends cloud, virtualization and big data

Customer success stories are good, however again, if interested in what works, what kind of works, or what does not work, chances are when looking for G2 vs. GQ, a non-scripted customer conversation or perspective of the good, the bad and the ugly is preferred, even if under NDA. Again, if time is limited which it usually is, focus on what is being done with your solution, where it is going and if compelled send follow-up material that can of course include MUD and FUD about others if that is your preference.

Then there is when during a 30 minute briefing, the vendor or solution provider is still talking about trends, customer pain points, what competitors are doing at 21 minutes into the call with no sign of an announcement, update or news in site

Lets not forget about the trick where the vendor marketing or PR person reaches out and says that the CEO, CMO, CTO or some other CxO or Chief Jailable Officer (CJO) wants to talk with you. Part of the trick is when the CxO actually makes it to the briefing and is not ready, does not know why the call is occurring, or, thinks that a request for an audience has been made with them for an interview or something else.

StorageIO industry trends cloud, virtualization and big data

A treat is when 3 to 4 minutes into a briefing, the vendor or solution provider has already framed up what and why they are doing something. This means getting to what they are announcing or planning on doing and getting into a conversation to discuss what they are doing and making good follow-up content and resources available.

StorageIO industry trends cloud, virtualization and big data

Sometimes a treat is when a briefer goes on autopilot nailing their script for 29 of a 30 minute session then use the last-minute to ask if there are any questions. The reason autopilot briefings can be a treat is when they are going over what is in the slide deck, webex, or press release thus affording an opportunity to get caught up on other things while talk at you. Hmm, perhaps need to consider playing some tricks in reward for those kind of treats? ;)

StorageIO industry trends cloud, virtualization and big data

Do not be scared, not everybody is out to trick you with treats, and not all treats have tricks attached to them. Be prepared, figure out who is playing tricks with treats, and who has treats without tricks.

Oh, and as a former IT customer, vendor and analyst, one of my favorites is contact information of my dogs to vendors who require registration on their websites for basic things such as data sheets. Another is supplying contact information of competing vendors sales reps to vendors who also require registration for basic data sheets or what should otherwise be generally available information as opposed to more premium treats. Of course there are many more fun tricks, however lets leave those alone for now.

Note: Zombie voting rules apply which means vote early, vote often, and of course vote for those who cannot include those that are dead (real or virtual).

Where To Learn More

View additiona related material via the following links.

Additional learning experiences along with common questions (and answers), as well as tips can be found in Software Defined Data Infrastructure Essentials book.

Software Defined Data Infrastructure Essentials Book SDDC

What This All Means

Watch out for tricks and treats, have a safe and fun Zombie (aka Halloween) season. See you while out and about this fall and don’t forget to take part in the ongoing zombie technology poll. Oh, and be safe with trick or treat and vendor fun games

Ok, nuff said, for now.

Gs

Greg Schulz – Microsoft MVP Cloud and Data Center Management, VMware vExpert 2010-2018. Author of Software Defined Data Infrastructure Essentials (CRC Press), as well as Cloud and Virtual Data Storage Networking (CRC Press), The Green and Virtual Data Center (CRC Press), Resilient Storage Networks (Elsevier) and twitter @storageio. Courteous comments are welcome for consideration. First published on https://storageioblog.com any reproduction in whole, in part, with changes to content, without source attribution under title or without permission is forbidden.

All Comments, (C) and (TM) belong to their owners/posters, Other content (C) Copyright 2006-2024 Server StorageIO and UnlimitedIO. All Rights Reserved. StorageIO is a registered Trade Mark (TM) of Server StorageIO.

What is the best kind of IO? The one you do not have to do

What is the best kind of IO? The one you do not have to do

data infrastructure server storage I/O trends

Updated 2/10/2018

What is the best kind of IO? If no IO (input/output) operation is the best IO, than the second best IO is the one that can be done as close to the application and processor with best locality of reference. Then the third best IO is the one that can be done in less time, or at least cost or impact to the requesting application which means moving further down the memory and storage stack (figure 1).

Storage and IO or I/O locality of reference and storage hirearchy
Figure 1 memory and storage hierarchy

The problem with IO is that they are basic operation to get data into and out of a computer or processor so they are required; however, they also have an impact on performance, response or wait time (latency). IO require CPU or processor time and memory to set up and then process the results as well as IO and networking resources to move data to their destination or retrieve from where stored. While IOs cannot be eliminated, their impact can be greatly improved or optimized by doing fewer of them via caching, grouped reads or writes (pre-fetch, write behind) among other techniques and technologies.

Think of it this way, instead of going on multiple errands, sometimes you can group multiple destinations together making for a shorter, more efficient trip; however, that optimization may also take longer. Hence sometimes it makes sense to go on a couple of quick, short low latency trips vs. one single larger one that takes half a day however accomplishes many things. Of course, how far you have to go on those trips (e.g. locality) makes a difference of how many you can do in a given amount of time.

What is locality of reference?

Locality of reference refers to how close (e.g location) data exists for where it is needed (being referenced) for use. For example, the best locality of reference in a computer would be registers in the processor core, then level 1 (L1), level 2 (L2) or level 3 (L3) onboard cache, followed by dynamic random access memory (DRAM). Then would come memory also known as storage on PCIe cards such as nand flash solid state device (SSD) or accessible via an adapter on a direct attached storage (DAS), SAN or NAS device. In the case of a PCIe nand flash SSD card, even though physically the nand flash SSD is closer to the processor, there is still the overhead of traversing the PCIe bus and associated drivers. To help offset that impact, PCIe cards use DRAM as cache or buffers for data along with Meta or control information to further optimize and improve locality of reference. In other words, help with cache hits, cache use and cache effectiveness vs. simply boosting cache utilization.

Where To Learn More

View additional NAS, NVMe, SSD, NVM, SCM, Data Infrastructure and HDD related topics via the following links.

Additional learning experiences along with common questions (and answers), as well as tips can be found in Software Defined Data Infrastructure Essentials book.

Software Defined Data Infrastructure Essentials Book SDDC

What This All Means

What can you do the cut the impact of IO

  • Establish baseline performance and availability metrics for comparison
  • Realize that IOs are a fact of IT virtual, physical and cloud life
  • Understand what is a bad IO along with its impact
  • Identify why an IO is bad, expensive or causing an impact
  • Find and fix the problem, either with software, application or database changes
  • Throw more software caching tools, hyper visors or hardware at the problem
  • Hardware includes faster processors with more DRAM and fast internal busses
  • Leveraging local PCIe flash SSD cards for caching or as targets
  • Utilize storage systems or appliances that have intelligent caching and storage optimization capabilities (performance, availability, capacity).
  • Compare changes and improvements to baseline, quantify improvement

Ok, nuff said, for now.

Gs

Greg Schulz – Microsoft MVP Cloud and Data Center Management, VMware vExpert 2010-2017 (vSAN and vCloud). Author of Software Defined Data Infrastructure Essentials (CRC Press), as well as Cloud and Virtual Data Storage Networking (CRC Press), The Green and Virtual Data Center (CRC Press), Resilient Storage Networks (Elsevier) and twitter @storageio. Courteous comments are welcome for consideration. First published on https://storageioblog.com any reproduction in whole, in part, with changes to content, without source attribution under title or without permission is forbidden.

All Comments, (C) and (TM) belong to their owners/posters, Other content (C) Copyright 2006-2024 Server StorageIO and UnlimitedIO. All Rights Reserved. StorageIO is a registered Trade Mark (TM) of Server StorageIO.

As the Hard Disk Drive HDD continues to spin

As the Hard Disk Drive HDD continues to spin

server storage data infrastructure i/o iop hdd ssd trends

Updated 2/10/2018

Despite having been repeatedly declared dead at the hands of some new emerging technology over the past several decades, the Hard Disk Drive (HDD) continues to spin and evolve as it moves towards its 60th birthday.

More recently HDDs have been declared dead due to flash SSD that according to some predictions, should have caused the HDD to be extinct by now.

Meanwhile, having not yet died in addition to having qualified for its AARP membership a few years ago, the HDD continues to evolve in capacity, smaller form factor, performance, reliability, density along with cost improvements.

Back in 2006 I did an article titled Happy 50th, hard drive, but will you make it to 60?

IMHO it is safe to say that the HDD will be around for at least a few more years if not another decade (or more).

This is not to say that the HDD has outlived its usefulness or that there are not other tiered storage mediums to do specific jobs or tasks better (there are).

Instead, the HDD continues to evolve and is complimented by flash SSD in a way that HDDs are complimenting magnetic tape (another declared dead technology) each finding new roles to support more data being stored for longer periods of time.

After all, there is no such thing as a data or information recession!

What the importance of this is about technology tiering and resource alignment, matching the applicable technology to the task at hand.

Technology tiering (Servers, storage, networking, snow removal) is about aligning the applicable resource that is best suited to a particular need in a cost as well as productive manner. The HDD remains a viable tiered storage medium that continues to evolve while taking on new roles coexisting with SSD and tape along with cloud resources. These and other technologies have their place which ideally is finding or expanding into new markets instead of simply trying to cannibalize each other for market share.

Here is a link to a good story by Lucas Mearian on the history or evolution of the hard disk drive (HDD) including how a 1TB device that costs about $60 today would have cost about a trillion dollars back in the 1950s. FWIW, IMHO the 1 trillion dollars is low and should be more around 2 to 5 trillion for the one TByte if you apply common costs for management, people, care and feeding, power, cooling, backup, BC, DR and other functions.

Where To Learn More

View additional NAS, NVMe, SSD, NVM, SCM, Data Infrastructure and HDD related topics via the following links.

Additional learning experiences along with common questions (and answers), as well as tips can be found in Software Defined Data Infrastructure Essentials book.

Software Defined Data Infrastructure Essentials Book SDDC

What This All Means

IMHO, it is safe to say that the HDD is here to stay for at least a few more years (if not decades) or at least until someone decides to try a new creative marketing approach by declaring it dead (again).

Ok, nuff said, for now.

Gs

Greg Schulz – Microsoft MVP Cloud and Data Center Management, VMware vExpert 2010-2017 (vSAN and vCloud). Author of Software Defined Data Infrastructure Essentials (CRC Press), as well as Cloud and Virtual Data Storage Networking (CRC Press), The Green and Virtual Data Center (CRC Press), Resilient Storage Networks (Elsevier) and twitter @storageio. Courteous comments are welcome for consideration. First published on https://storageioblog.com any reproduction in whole, in part, with changes to content, without source attribution under title or without permission is forbidden.

All Comments, (C) and (TM) belong to their owners/posters, Other content (C) Copyright 2006-2024 Server StorageIO and UnlimitedIO. All Rights Reserved. StorageIO is a registered Trade Mark (TM) of Server StorageIO.

What is DFR or Data Footprint Reduction?

What is DFR or Data Footprint Reduction?

What is DFR or Data Footprint Reduction?

Updated 10/9/2018

What is DFR or Data Footprint Reduction?

Data Footprint Reduction (DFR) is a collection of techniques, technologies, tools and best practices that are used to address data growth management challenges. Dedupe is currently the industry darling for DFR particularly in the scope or context of backup or other repetitive data.

However DFR expands the scope of expanding data footprints and their impact to cover primary, secondary along with offline data that ranges from high performance to inactive high capacity.

Consequently the focus of DFR is not just on reduction ratios, its also about meeting time or performance rates and data protection windows.

This means DFR is about using the right tool for the task at hand to effectively meet business needs, and cost objectives while meeting service requirements across all applications.

Examples of DFR technologies include Archiving, Compression, Dedupe, Data Management and Thin Provisioning among others.

Read more about DFR in Part I and Part II of a two part series found here and here.

Where to learn more

Learn more about data footprint reducton (DFR), data footprint overhead and related topics via the following links:

Additional learning experiences along with common questions (and answers), as well as tips can be found in Software Defined Data Infrastructure Essentials book.

Software Defined Data Infrastructure Essentials Book SDDC

What this all means

That is all for now, hope you find these ongoing series of current or emerging Industry Trends and Perspectives posts of interest.

Ok, nuff said, for now.

Cheers Gs

Greg Schulz – Microsoft MVP Cloud and Data Center Management, VMware vExpert 2010-2018. Author of Software Defined Data Infrastructure Essentials (CRC Press), as well as Cloud and Virtual Data Storage Networking (CRC Press), The Green and Virtual Data Center (CRC Press), Resilient Storage Networks (Elsevier) and twitter @storageio. Courteous comments are welcome for consideration. First published on https://storageioblog.com any reproduction in whole, in part, with changes to content, without source attribution under title or without permission is forbidden.

All Comments, (C) and (TM) belong to their owners/posters, Other content (C) Copyright 2006-2024 Server StorageIO and UnlimitedIO. All Rights Reserved. StorageIO is a registered Trade Mark (TM) of Server StorageIO.

What is the Future of Servers?

Recently I provided some comments and perspectives on the future of servers in an article over at Processor.com.

In general, blade servers will become more ubiquitous, that is they wont go away, rather become more common place with even higher density processors with more cores and performance along with faster I/O and larger memory capacity per given footprint.

While the term blade server may fade giving way to some new term or phrase, rest assured their capabilities and functionality will not disappear, rather be further enhanced to support virtualization with VMware vsphere, Microsoft HyperV, Citrix/Zen along with public and private clouds, both for consolidation and in the next wave of virtualization called life beyond consolidation.

The other trend is that not only will servers be able to support more processing and memory per footprint; they will also do that drawing less energy requiring lower cooling demands, hence more Ghz per watt along with energy savings modes when less work needs to be performed.

Another trend is around convergence both in terms of packaging along with technology improvements from a server, I/O networking and storage perspective. For example, enhancements to shared PCIe with I/O virtualization, hypervisor optimization, and integration such as the recently announced EMC, Cisco, Intel and VMware VCE coalition and vblocks.

Read more including my comments in the article here.

Ok, nuff said.

Cheers gs

Greg Schulz – Author Cloud and Virtual Data Storage Networking (CRC Press), The Green and Virtual Data Center (CRC Press) and Resilient Storage Networks (Elsevier)
twitter @storageio

All Comments, (C) and (TM) belong to their owners/posters, Other content (C) Copyright 2006-2024 Server StorageIO and UnlimitedIO LLC All Rights Reserved