
Part II – Some server storage I/O workload scripts and results

Updated 1/28/2018
This is the second in a two part series of posts pertaining to using some common server storage I/O workload benchmark tools and scripts. View part I here which includes overview, background and information about the tools used and related topics.
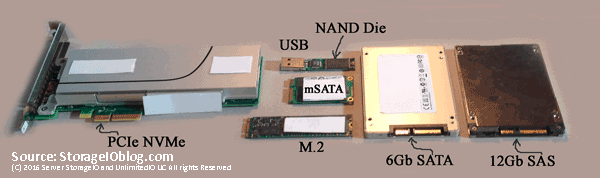
Various NVM flash SSD including NVMe devices
Following are some server I/O benchmark workload scripts to exercise various storage devices such as Non-Volatile Memory (NVM) flash Solid State Devices (SSDs) or Hard Disk Drives (HDD) among others.
The Workloads
Some ways that can impact the workload performance results besides changing the I/O size, read write, random sequential mix is the number of threads, workers and jobs. Note that in the workload steps, the larger 1MB and sequential scenarios have fewer threads, workers vs. the smaller IOP or activity focused workloads. Too many threads or workers can cause overhead and you will reach a point of diminishing return at some point. Likewise too few and you will not drive the system under test (SUT) or device under test (DUT) to its full potential. If you are not sure how many threads or workers to use, run some short calibration tests to see the results before doing a large, longer test.
Keep in mind that the best benchmark or workload is your own application running with similar load to what you would see in real world, along with applicable features, configuration and functionality enabled. The second best would be those that closely resemble your workload characteristics and that are relevant.
The following workloads involved a system test initiator (STI) server driving workload using the different tools as well as scripts shown. The STI sends the workload to a SUT or DUT that can be a single drive, card or multiple devices, storage system or appliance. Warning: The following workload tests does both reads and writes which can be destructive to your device under test. Exercise caution on the device and file name specified to avoid causing a problem that might result in you testing your backup / recovery process. Likewise no warranty is given, implied or made for these scripts or their use or results, they are simply supplied as is for your reference.
The four free tools that I’m using with this set of scripts are:
- Microsoft Diskspd (free), get the tool and bits here or here (open source), learn more about Diskspd here.
- FIO.exe (free), get the tool and bits here or here among other venues.
- Vdbench (free with registration), get the tool and bits here or here among other venues.
- Iometer (free), get the tool and bits here among other venues.
Notice: While best effort has been made to verify the above links, they may change over time and you are responsible for verifying the safety of links and your downloads
Microsoft Diskspd workloads
Note that a 300GB size file named iobw.tst on device N: is being used for performing read and write I/Os to. There are 160 threads, I/O size of 4KB and 8KB varying from 100% Read (0% write), 70% Read (30% write) and 0% Read (100% write) with random (seek) and no hardware or software cache. Also specified are to collect latency statistics, a 30 second warm up ramp up time, and a quick 5 minute duration (test time). 5 minutes is a quick test for calibration, verify your environment however relatively short for a real test which should be in the hours or more depending on your needs.
Note that the output results are put into a file with a name describing the test tool, workload and other useful information such as date and time. You may also want to specify a different directory where output files are placed.
diskspd.exe -c300G -o160 -t160 -b4K -w0 -W30 -d300 -h -fr  N:iobw.tst -L  > DiskSPD_300G_4KRan100Read_160x160_072416_8AM.txt
diskspd.exe -c300G -o160 -t160 -b4K -w30 -W30 -d300 -h -fr  N:iobw.tst -L  > DiskSPD_300G_4KRan70Read_160x160_072416_8AM.txt
diskspd.exe -c300G -o160 -t160 -b4K -w100 -W30 -d300 -h -fr  N:iobw.tst -L  > DiskSPD_300G_4KRan0Read_160x160_072416_8AM.txt
diskspd.exe -c300G -o160 -t160 -b8K -w0 -W30 -d300 -h -fr  N:iobw.tst -L  > DiskSPD_300G_8KRan100Read_160x160_072416_8AM.txt
diskspd.exe -c300G -o160 -t160 -b8K -w30 -W30 -d300 -h -fr  N:iobw.tst -L  > DiskSPD_300G_8KRan70Read_160x160_072416_8AM.txt
diskspd.exe -c300G -o160 -t160 -b8K -w100 -W30 -d300 -h -fr  N:iobw.tst -L  > DiskSPD_300G_8KRan0Read_160x160_072416_8AM.txt
The following Diskspd tests use similar settings as above, however instead of random, sequential is specified, threads and outstanding I/Os are reduced while I/O size is set to 1MB, then 8KB, with 100% read and 100% write scenarios. The -t specifies the number of threads and -o number of outstanding I/Os per thread.
diskspd.exe -c300G -o32 -t132 -b1M -w0 -W30 -d300 -h -si  N:iobw.tst -L  > DiskSPD_300G_1MSeq100Read_32x32_072416_8AM.txt
diskspd.exe -c300G -o32 -t132 -b1M -w100 -W30 -d300 -h -si  N:iobw.tst -L  > DiskSPD_300G_1MSeq0Read_32x32_072416_8AM.txt
diskspd.exe -c300G -o160 -t160 -b8K -w0 -W30 -d300 -h -si  N:iobw.tst -L  > DiskSPD_300G_8KSeq100Read_32x32_072416_8AM.txt
diskspd.exe -c300G -o160 -t160 -b8K -w100 -W30 -d300 -h -si  N:iobw.tst -L  > DiskSPD_300G_8KSeq0Read_32x32_072416_8AM.txt
Fio.exe workloads
Next are the fio workloads similar to those run using Diskspd except the sequential scenarios are skipped.
fio --filename=N\:\iobw.tst --filesize=300000M --direct=1  --rw=randrw --refill_buffers --norandommap --randrepeat=0 --ioengine=windowsaio  --ba=4k --bs=4k --rwmixread=100 --iodepth=32 --numjobs=5 --exitall --time_based  --ramp_time=30 --runtime=300 --group_reporting --name=xxx  --output=FIO_300000M_4KRan100Read_5x32_072416_8AM.txt
fio --filename=N\:\iobw.tst --filesize=300000M --direct=1  --rw=randrw --refill_buffers --norandommap --randrepeat=0 --ioengine=windowsaio  --ba=4k --bs=4k --rwmixread=70 --iodepth=32 --numjobs=5 --exitall --time_based  --ramp_time=30 --runtime=300 --group_reporting --name=xxx  --output=FIO_300000M_4KRan70Read_5x32_072416_8AM.txt
fio --filename=N\:\iobw.tst --filesize=300000M --direct=1  --rw=randrw --refill_buffers --norandommap --randrepeat=0 --ioengine=windowsaio  --ba=4k --bs=4k --rwmixread=0 --iodepth=32 --numjobs=5 --exitall --time_based  --ramp_time=30 --runtime=300 --group_reporting --name=xxx  --output=FIO_300000M_4KRan0Read_5x32_072416_8AM.txt
fio --filename=N\:\iobw.tst --filesize=300000M --direct=1  --rw=randrw --refill_buffers --norandommap --randrepeat=0 --ioengine=windowsaio  --ba=8k --bs=8k --rwmixread=100 --iodepth=32 --numjobs=5 --exitall --time_based  --ramp_time=30 --runtime=300 --group_reporting --name=xxx  --output=FIO_300000M_8KRan100Read_5x32_072416_8AM.txt
fio --filename=N\:\iobw.tst --filesize=300000M --direct=1  --rw=randrw --refill_buffers --norandommap --randrepeat=0 --ioengine=windowsaio  --ba=8k --bs=8k --rwmixread=70 --iodepth=32 --numjobs=5 --exitall --time_based  --ramp_time=30 --runtime=300 --group_reporting --name=xxx  --output=FIO_300000M_8KRan70Read_5x32_072416_8AM.txt
fio --filename=N\:\iobw.tst --filesize=300000M --direct=1  --rw=randrw --refill_buffers --norandommap --randrepeat=0 --ioengine=windowsaio  --ba=8k --bs=8k --rwmixread=0 --iodepth=32 --numjobs=5 --exitall --time_based  --ramp_time=30 --runtime=300 --group_reporting --name=xxx  --output=FIO_300000M_8KRan0Read_5x32_072416_8AM.txt
Vdbench workloads
Next are the Vdbench workloads similar to those used with the Microsoft Diskspd scenarios. In addition to making sure Vdbench is installed and working, you will need to create a text file called seqrxx.txt containing the following:
hd=localhost,jvms=!jvmn

sd=sd1,lun=!drivename,openflags=directio,size=!dsize

wd=mix,sd=sd1

rd=!jobname,wd=mix,elapsed=!etime,interval=!itime,iorate=max,forthreads=(!tthreads),forxfersize=(!worktbd),forseekpct=(!workseek),forrdpct=(!workread),openflags=directio
The following are the commands that call the Vdbench script file. Note Vdbench puts output files (yes, plural there are many results) in a output folder.
vdbench -f seqrxx.txt dsize=300G  tthreads=160 jvmn=64 worktbd=4k workseek=100 workread=100 jobname=NVME etime=300 itime=30 drivename="\\.\N:\iobw.tst" -o  vdbench_NNVMe_300GB_64JVM_160TH_4K100Ran100Read_0726166AM
vdbench -f seqrxx.txt dsize=300G  tthreads=160 jvmn=64 worktbd=4k workseek=100 workread=70 jobname=NVME etime=300 itime=30 drivename="\\.\N:\iobw.tst" -o vdbench_NNVMe_300GB_64JVM_160TH_4K100Ran70Read_072416_8AM
vdbench -f seqrxx.txt dsize=300G  tthreads=160 jvmn=64 worktbd=4k workseek=100 workread=0 jobname=NVME etime=300 itime=30 drivename="\\.\N:\iobw.tst" -o vdbench_NNVMe_300GB_64JVM_160TH_4K100Ran0Read_072416_8AM
vdbench -f seqrxx.txt dsize=300G  tthreads=160 jvmn=64 worktbd=8k workseek=100 workread=100 jobname=NVME etime=300 itime=30 drivename="\\.\N:\iobw.tst" -o vdbench_NNVMe_300GB_64JVM_160TH_8K100Ran100Read_072416_8AM
vdbench -f seqrxx.txt dsize=300G  tthreads=160 jvmn=64 worktbd=8k workseek=100 workread=70 jobname=NVME etime=300 itime=30 drivename="\\.\N:\iobw.tst" -o vdbench_NNVMe_300GB_64JVM_160TH_8K100Ran70Read_072416_8AM
vdbench -f seqrxx.txt dsize=300G  tthreads=160 jvmn=64 worktbd=8k workseek=100 workread=0 jobname=NVME etime=300 itime=30 drivename="\\.\N:\iobw.tst" -o vdbench_NNVMe_300GB_64JVM_160TH_8K100Seq0Read_072416_8AM
vdbench -f seqrxx.txt dsize=300G  tthreads=160 jvmn=64 worktbd=8k workseek=0 workread=100 jobname=NVME etime=300 itime=30 drivename="\\.\N:\iobw.tst" -o vdbench_NNVMe_300GB_64JVM_160TH_8K100Seq100Read_072416_8AM
vdbench -f seqrxx.txt dsize=300G  tthreads=160 jvmn=64 worktbd=8k workseek=0 workread=70 jobname=NVME etime=300 itime=30 drivename="\\.\N:\iobw.tst" -o vdbench_NNVMe_300GB_64JVM_160TH_8K100Seq70Read_072416_8AM
vdbench -f seqrxx.txt dsize=300G  tthreads=160 jvmn=64 worktbd=8k workseek=0 workread=0 jobname=NVME etime=300 itime=30 drivename="\\.\N:\iobw.tst" -o vdbench_NNVMe_300GB_64JVM_160TH_8K100Seq0Read_072416_8AM
vdbench -f seqrxx.txt dsize=300G  tthreads=32 jvmn=64 worktbd=1M workseek=0 workread=100 jobname=NVME etime=300 itime=30 drivename="\\.\N:\iobw.tst" -o vdbench_NNVMe_300GB_64JVM_32TH_1M100Seq100Read_072416_8AM
vdbench -f seqrxx.txt dsize=300G  tthreads=32 jvmn=64 worktbd=1M workseek=0 workread=0 jobname=NVME etime=300 itime=30 drivename="\\.\N:\iobw.tst" -o vdbench_NNVMe_300GB_64JVM_32TH_1M100Seq0Read_072416_8AM
Iometer workloads
Last however not least, lets do an Iometer run. The following command calls an Iometer input file (icf) that you can find here. In that file you will need to make a few changes including the name of the server where Iometer is running, description and device under test address. For example in the icf file change SIOSERVER to the name of the server where you will be running Iometer from. Also change the address for the DUT, for example N: to what ever address, drive, mount point you are using. Also update the description accordingly (e.g. "NVME" to "Your test example".
Here is the command line to run Iometer specifying an icf and where to put the results in a CSV file that can be imported into Excel or other tools.
iometer /c iometer_5work32q_intel_Profile.icf /r iometer_nvmetest_5work32q_072416_8AM.csv

What About The Results?
For context, the following results were run on a Lenovo TS140 (32GB RAM), single socket quad core (3.2GHz) Intel E3-1225 v3 with an Intel NVMe 750 PCIe AiC (Intel SSDPEDMW40). Out of the box Microsoft Windows NVMe drive and controller drivers were used (e.g. 6.3.9600.18203 and 6.3.9600.16421). Operating system is Windows 2012 R2 (bare metal) with NVMe PCIe card formatted with ReFS file system. Workload generator and benchmark driver tools included Microsoft Diskspd version 2.012, Fio.exe version 2.2.3, Vdbench 50403 and Iometer 1.1.0. Note that there are newer versions of the various workload generation tools.
Example results are located here.
Where To Learn More
- Part I of this two part series providing overview and background
- How many IOPs can an SSD do?
- Which Enterprise HDDs to use for a content server?
- Learn more about NVM and SSDs at www.thenvmeplace.com and www.thessdplace.com
- Server Storage I/O performance and related tools page
Additional learning experiences along with common questions (and answers), as well as tips can be found in Software Defined Data Infrastructure Essentials book.

What This All Means
Remember, everything is not the same in the data center or with data infrastructures that support different applications.
While some tools are more robust or better than others for different things, ultimately its usually not the tool that results in a bad benchmark or comparison, its the configuration or lack of including workload settings that are not relevant or applicable. The best benchmark, workload or simulation is your own application. Second best is one that closely resembles your application workload characteristics. A bad benchmark is one that has no relevance to your environment, application use scenario. Take and treat all benchmark or workload simulation results with a grain of salt as something to compare, contrast or make reference to in the proper context.
Ok, nuff said, for now.
Gs
Greg Schulz – Microsoft MVP Cloud and Data Center Management, VMware vExpert 2010-2017 (vSAN and vCloud). Author of Software Defined Data Infrastructure Essentials (CRC Press), as well as Cloud and Virtual Data Storage Networking (CRC Press), The Green and Virtual Data Center (CRC Press), Resilient Storage Networks (Elsevier) and twitter @storageio. Courteous comments are welcome for consideration. First published on https://storageioblog.com any reproduction in whole, in part, with changes to content, without source attribution under title or without permission is forbidden.
All Comments, (C) and (TM) belong to their owners/posters, Other content (C) Copyright 2006-2026 Server StorageIO and UnlimitedIO. All Rights Reserved. StorageIO is a registered Trade Mark (TM) of Server StorageIO.