

Updated 1/12/2018
This is the third in a five-part mini-series providing a primer and overview of NVMe. View companion posts and more material at www.thenvmeplace.com.
How fast is NVMe?
It depends! Generally speaking NVMe is fast!
However fast interfaces and protocols also need fast storage devices, adapters, drivers, servers, operating systems and hypervisors as well as applications that drive or benefit from the increased speed.
A server storage I/O example is in figure 5 where a 6 Gbps SATA NVM flash SSD (left) is shown with an NVMe 8639 (x4) drive that were directly attached to a server. The workload is 8 Kbyte sized random writes with 128 threads (workers) showing results for IOPs (solid bar) along with response time (dotted line). Not surprisingly the NVMe device has a lower response time and a higher number of IOPs. However also note how the amount of CPU time used per IOP is lower on the right with the NVMe drive.
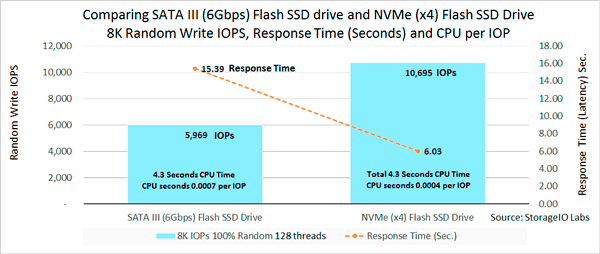
Figure 5 6 Gbps SATA NVM flash SSD vs. NVMe flash SSD
While many people are aware or learning about the IOP and bandwidth improvements as well as the decrease in latency with NVMe, something that gets overlooked is how much less CPU is used. If a server is spending time in wait modes that can result in lost productivity, by finding and removing the barriers more work can be done on a given server, perhaps even delaying a server upgrade.
In figure 5 notice the lower amount of CPU used per work activity being done (e.g. I/O or IOP) which translates to more effective resource use of your server. What that means is either doing more work with what you have, or potentially delaying a CPU server upgrade, or, using those extra CPU cycles to power software defined storage management stacks including erasure coding or advanced parity RAID, replication and other functions.
Table 1 shows relative server I/O performance of some NVM flash SSD devices across various workloads. As with any performance, the comparison takes them, and the following with a grain of salt as your speed will vary.
8KB I/O Size | 1MB I/O size | ||||||||
NAND flash SSD | 100% Seq. Read | 100% Seq. Write | 100% Ran. Read | 100% Ran. Write | 100% Seq. Read | 100% Seq. Write | 100% Ran. Read | 100% Ran. Write | |
NVMe | IOPs | 41829.19 | 33349.36 | 112353.6 | 28520.82 | 1437.26 | 889.36 | 1336.94 | 496.74 |
PCIe | Bandwidth | 326.79 | 260.54 | 877.76 | 222.82 | 1437.26 | 889.36 | 1336.94 | 496.74 |
AiC | Resp. | 3.23 | 3.90 | 1.30 | 4.56 | 178.11 | 287.83 | 191.27 | 515.17 |
CPU / IOP | 0.001571 | 0.002003 | 0.000689 | 0.002342 | 0.007793 | 0.011244 | 0.009798 | 0.015098 | |
12Gb | IOPs | 34792.91 | 34863.42 | 29373.5 | 27069.56 | 427.19 | 439.42 | 416.68 | 385.9 |
SAS | Bandwidth | 271.82 | 272.37 | 229.48 | 211.48 | 427.19 | 429.42 | 416.68 | 385.9 |
Resp. | 3.76 | 3.77 | 4.56 | 5.71 | 599.26 | 582.66 | 614.22 | 663.21 | |
CPU / IOP | 0.001857 | 0.00189 | 0.002267 | 0.00229 | 0.011236 | 0.011834 | 0.01416 | 0.015548 | |
6Gb | IOPs | 33861.29 | 9228.49 | 28677.12 | 6974.32 | 363.25 | 65.58 | 356.06 | 55.86 |
SATA | Bandwidth | 264.54 | 72.1 | 224.04 | 54.49 | 363.25 | 65.58 | 356.06 | 55.86 |
Resp. | 4.05 | 26.34 | 4.67 | 35.65 | 704.70 | 3838.59 | 718.81 | 4535.63 | |
CPU / IOP | 0.001899 | 0.002546 | 0.002298 | 0.003269 | 0.012113 | 0.032022 | 0.015166 | 0.046545 |
Table 1 Relative performance of various protocols and interfaces
The workload results in table 1 were generated using a vdbench script running on a Windows 2012 R2 based server and are intended to be a relative indicator of different protocol and interfaces; your performance mileage will vary. The results shown below compare the number of IOPs (activity rate) for reads, writes, random and sequential across small 8KB and large 1MB sized I/Os.
Also shown in table 1 are bandwidth or throughput (e.g. amount of data moved), response time and the amount of CPU used per IOP. Note in table 1 how NVMe can do higher IOPs with a lower CPU per IOP, or, using a similar amount of CPU, do more work at a lower latency. SSD has been used for decades to help reduce CPU bottlenecks or defer server upgrades by removing I/O wait times and reduce CPU consumption (e.g. wait or lost time).
Can NVMe solutions run faster than those shown above? Absolutely!
Where To Learn More
View additional NVMe, SSD, NVM, SCM, Data Infrastructure and related topics via the following links.
- NVMe overview and primer – Part I
- Part II – NVMe overview and primer (Different Configurations)
- Part III – NVMe overview and primer (Need for Performance Speed)
- Part IV – NVMe overview and primer (Where and How to use NVMe)
- Part V – NVMe overview and primer (Where to learn more, what this all means)
- PCIe Server I/O Fundamentals
- If NVMe is the answer, what are the questions?
- NVMe Wont Replace Flash By Itself
- Via Computerweekly – NVMe discussion: PCIe card vs U.2 and M.2
- Intel and Micron unveil new 3D XPoint Non Volatile Memory (NVM) for servers and storage
- Part II – Intel and Micron new 3D XPoint server and storage NVM
- Part III – 3D XPoint new server storage memory from Intel and Micron
- Server storage I/O benchmark tools, workload scripts and examples (Part I) and (Part II)
- Data Infrastructure Overview, Its Whats Inside of Data Centers
- All You Need To Know about Remote Office/Branch Office Data Protection Backup (free webinar with registration)
- Software Defined, Converged Infrastructure (CI), Hyper-Converged Infrastructure (HCI) resources
- The SSD Place (SSD, NVM, PM, SCM, Flash, NVMe, 3D XPoint, MRAM and related topics)
- The NVMe Place (NVMe related topics, trends, tools, technologies, tip resources)
- Data Protection Diaries (Archive, Backup/Restore, BC, BR, DR, HA, RAID/EC/LRC, Replication, Security)
- Software Defined Data Infrastructure Essentials (CRC Press 2017) including SDDC, Cloud, Container and more
- Various Data Infrastructure related events, webinars and other activities
Additional learning experiences along with common questions (and answers), as well as tips can be found in Software Defined Data Infrastructure Essentials book.

What This All Means
Continue reading about NVMe with Part IV (Where and How to use NVMe) in this five-part series, or jump to Part I, Part II or Part V.
Ok, nuff said, for now.
Gs
Greg Schulz – Microsoft MVP Cloud and Data Center Management, VMware vExpert 2010-2017 (vSAN and vCloud). Author of Software Defined Data Infrastructure Essentials (CRC Press), as well as Cloud and Virtual Data Storage Networking (CRC Press), The Green and Virtual Data Center (CRC Press), Resilient Storage Networks (Elsevier) and twitter @storageio. Courteous comments are welcome for consideration. First published on https://storageioblog.com any reproduction in whole, in part, with changes to content, without source attribution under title or without permission is forbidden.
All Comments, (C) and (TM) belong to their owners/posters, Other content (C) Copyright 2006-2026 Server StorageIO and UnlimitedIO. All Rights Reserved. StorageIO is a registered Trade Mark (TM) of Server StorageIO.