
New SDDI Essentials Book by Greg Schulz of Server StorageIO
Cloud, Converged, Virtual Fundamental Server Storage I/O Tradecraft

Update 1/21/2018
Over the past several months I have posted, commenting, presenting and discussing more about Software Defined Data Infrastructure Essentials aka SDDI or SDDC and SDI. Now it is time to announce my new book (my 4th solo project), Software Defined Data Infrastructure Essentials Book (CRC Press). Software Defined Data Infrastructure Essentials is now generally available at various global venues in hardcopy, hardback print as well as various electronic versions including via Amazon and CRC Press among others. For those attending VMworld 2017 in Las Vegas, I will be doing a book signing, meet and greet at 1PM Tuesday August 29 in the VMworld book store, as well as presenting at various other fall industry events.
Software Defined Data Infrastructure Essentials Book Announcement
(Via Businesswire) Stillwater, Minnesota – August 23, 2017 – Server StorageIO, a leading independent IT industry advisory and consultancy firm, in conjunction with publisher CRC Press, a Taylor and Francis imprint, announced the release and general availability of “Software-Defined Data Infrastructure Essentials,” a new book by Greg Schulz, noted author and Server StorageIO founder.
The Software Defined Data Infrastructure Essentials book covers physical, cloud, converged (and hyper-converged), container, and virtual server storage I/O networking technologies, revealing trends, tools, techniques, and tradecraft skills.
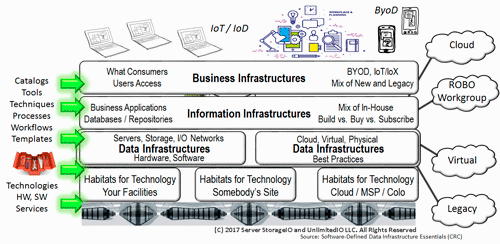
Various IT and Cloud Infrastructure Layers including Data Infrastructures
From cloud web scale to enterprise and small environments, IoT to database, software-defined data center (SDDC) to converged and container servers, flash solid state devices (SSD) to storage and I/O networking,, the book helps develop or refine hardware, software, services and management experiences, providing real-world examples for those involved with or looking to expand their data infrastructure education knowledge and tradecraft skills.
Software Defined Data Infrastructure Essentials book topics include:
- Cloud, Converged, Container, and Virtual Server Storage I/O networking
- Data protection (archive, availability, backup, BC/DR, snapshot, security)
- Block, file, object, structured, unstructured and data value
- Analytics, monitoring, reporting, and management metrics
- Industry trends, tools, techniques, decision making
- Local, remote server, storage and network I/O troubleshooting
- Performance, availability, capacity and economics (PACE)
Where To Purchase Your Copy
Order via Amazon.com and CRC Press along with Google Books among other global venues.
What People Are Saying About Software Defined Data Infrastructure Essentials Book
“From CIOs to operations, sales to engineering, this book is a comprehensive reference, a must-read for IT infrastructure professionals, beginners to seasoned experts,” said Tom Becchetti, advisory systems engineer.
“We had a front row seat watching Greg present live in our education workshop seminar sessions for ITC professionals in the Netherlands material that is in this book. We recommend this amazing book to expand your converged and data infrastructure knowledge from beginners to industry veterans.”
Gert and Frank Brouwer – Brouwer Storage Consultancy
“Software-Defined Data Infrastructures provides the foundational building blocks to improve your craft in several areas including applications, clouds, legacy, and more. IT professionals, as well as sales professionals and support personal, stand to gain a great deal by reading this book.”
Mark McSherry- Oracle Regional Sales Manager
“Greg Schulz has provided a complete ‘toolkit’ for storage management along with the background and framework for the storage or data infrastructure professional (or those aspiring to become one).”
Greg Brunton – Experienced Storage and Data Management Professional
“Software-defined data infrastructures are where hardware, software, server, storage, I/O networking and related services converge inside data centers or clouds to protect, preserve, secure and serve applications and data,” said Schulz. “Both readers who are new to data infrastructures and seasoned pros will find this indispensable for gaining and expanding their knowledge.”

More About Software Defined Data Infrastructure Essentials
Software Defined Data Infrastructures (SDDI) Essentials provides fundamental coverage of physical, cloud, converged, and virtual server storage I/O networking technologies, trends, tools, techniques, and tradecraft skills. From webscale, software-defined, containers, database, key-value store, cloud, and enterprise to small or medium-size business, the book is filled with techniques, and tips to help develop or refine your server storage I/O hardware, software, Software Defined Data Centers (SDDC), Software Data Infrastructures (SDI) or Software Defined Anything (SDx) and services skills. Whether you are new to data infrastructures or a seasoned pro, you will find this comprehensive reference indispensable for gaining as well as expanding experience with technologies, tools, techniques, and trends.
This book is the definitive source providing comprehensive coverage about IT and cloud Data Infrastructures for experienced industry experts to beginners. Coverage of topics spans from higher level applications down to components (hardware, software, networks, and services) that get defined to create data infrastructures that support business, web, and other information services. This includes Servers, Storage, I/O Networks, Hardware, Software, Management Tools, Physical, Software Defined Virtual, Cloud, Docker, Containers (Docker and others) as well as Bulk, Block, File, Object, Cloud, Virtual and software defined storage.
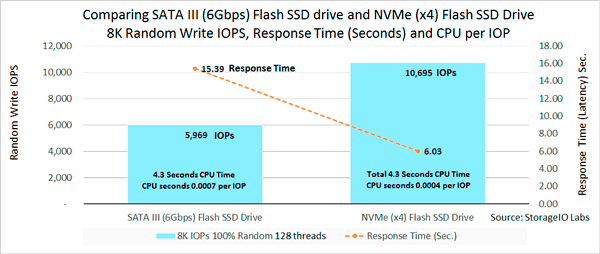
Additional topics include Data protection (Availability, Archiving, Resiliency, HA, BC, BR, DR, Backup), Performance and Capacity Planning, Converged Infrastructure (CI), Hyper-Converged, NVM and NVMe Flash SSD, Storage Class Memory (SCM), NVMe over Fabrics, Benchmarking (including metrics matter along with tools), Performance Capacity Planning and much more including whos doing what, how things work, what to use when, where, why along with current and emerging trends.
Book Features
ISBN-13: 978-1498738156
ISBN-10: 149873815X
Hardcover: 672 pages
(Available in Kindle and other electronic formats)
Over 200 illustrations and 70 plus tables
Frequently asked Questions (and answers) along with many tips
Various learning exercises, extensive glossary and appendices
Publisher: Auerbach/CRC Press Publications; 1 edition (June 19, 2017)
Language: English

Where To Learn More
Learn more about related technology, trends, tools, techniques, and tips with the following links.
- Whats a data infrastructure? (Via NetworkWorld)
- Software Defined Data Infrastructure Essentials (CRC Press) book companion page (includes various images, sample figures and added content)
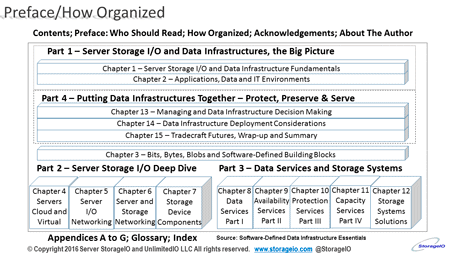
- Click here to view (PDF) table of contents (TOC)
- Click here to view (PDF) Preface, who should read, how organized and related material
- Search and see whats inside Software Defined Data Infrastructure Essentials using this link to Google Books
- Do you have an IT trade craft skills gap? (Via NetworkWorld)
- Ensure your data infrastructure remains available and resilient (Via NetworkWorld)
- Data Infrastructure Primer and Overview (Its Whats Inside The Data Center)
- Data Infrastructure Server Storage I/O Tradecraft Trends
- Data Infrastructure Server Storage I/O related Tradecraft Overview
- Some server storage I/O benchmark workload scripts (Part I)
- Server Storage I/O Benchmarking Performance Resource Tools
- Server Storage I/O Converged (CI) Hyper-converged (HCI) overview
- Data Infrastructure industry links page – Various Data Infrastructure related links
- Welcome to the Data Protection Diaries – Data protection related topics
- Time to restore your backups, do you know where is your data is?
- Object and Cloud Storage Center (www.objectstoragecenter.com)
- www.thessdplace.com – NVM, flash, SSD, SCM and related topics
- www.thenvmeplace.com – NVM Express (NVMe) related topics
- Cloud and Virtual Data Storage Networking (CRC Press) “Intel Recommended Reading” book companion page
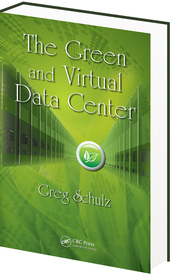
- The Green and Virtual Data Center (CRC Press) “Intel Recommended Reading” book companion page
- Resilient Storage Networks – Designing Flexible Scalable Data Infrastructures (Elsevier) book companion page
- Other books, articles, tips, blog posts, news, events, webinars, videos by Greg Schulz and Server StorageIO (portfolio page)
Various IT and Cloud Infrastructure Layers including Data Infrastructures
Additional learning experiences along with common questions (and answers), as well as tips can be found in Software Defined Data Infrastructure Essentials book.

What This All Means
Data Infrastructures exist to protect, preserve, secure and serve information along with the applications and data they depend on. With more data being created at a faster rate, along with the size of data becoming larger, increased application functionality to transform data into information means more demands on data infrastructures and their underlying resources.
Software-Defined Data Infrastructure Essentials: Cloud, Converged, and Virtual Fundamental Server Storage I/O Tradecraft is for people who are currently involved with or looking to expand their knowledge and tradecraft skills (experience) of data infrastructures. Software-defined data centers (SDDC), software data infrastructures (SDI), software-defined data infrastructure (SDDI) and traditional data infrastructures are made up of software, hardware, services, and best practices and tools spanning servers, I/O networking, and storage from physical to software-defined virtual, container, and clouds. The role of data infrastructures is to enable and support information technology (IT) and organizational information applications.
Additional learning experiences along with common questions (and answers), as well as tips can be found in Software Defined Data Infrastructure Essentials book.
Everything is not the same in business, organizations, IT, and in particular servers, storage, and I/O. This means that there are different audiences who will benefit from reading this book. Because everything and everybody is not the same when it comes to server and storage I/O along with associated IT environments and applications, different readers may want to focus on various sections or chapters of this book.
If you are looking to expand your knowledge into an adjacent area or to understand whats under the hood, from converged, hyper-converged to traditional data infrastructures topics, this book is for you. For experienced storage, server, and networking professionals, this book connects the dots as well as provides coverage of virtualization, cloud, and other convergence themes and topics.
This book is also for those who are new or need to learn more about data infrastructure, server, storage, I/O networking, hardware, software, and services. Another audience for this book is experienced IT professionals who are now responsible for or working with data infrastructure components, technologies, tools, and techniques.
Learn more here about Software Defined Data Infrastructure (SDDI) Essentials book along with cloud, converged, and virtual fundamental server storage I/O tradecraft topics, order your copy from Amazon.com or CRC Press here, and thank you in advance for learning more about SDDI and related topics.
Ok, nuff said, for now.
Gs
Greg Schulz – Microsoft MVP Cloud and Data Center Management, VMware vExpert 2010-2017 (vSAN and vCloud). Author of Software Defined Data Infrastructure Essentials (CRC Press), as well as Cloud and Virtual Data Storage Networking (CRC Press), The Green and Virtual Data Center (CRC Press), Resilient Storage Networks (Elsevier) and twitter @storageio. Courteous comments are welcome for consideration. First published on https://storageioblog.com any reproduction in whole, in part, with changes to content, without source attribution under title or without permission is forbidden.
All Comments, (C) and (TM) belong to their owners/posters, Other content (C) Copyright 2006-2026 Server StorageIO and UnlimitedIO. All Rights Reserved. StorageIO is a registered Trade Mark (TM) of Server StorageIO.


")
")
")
")


