Cloud Conversations: AWS S3 Cross Region Replication storage enhancements
Amazon Web Services (AWS) recently among other enhancements announced new Simple Storage Service (S3) cross-region replication of objects from a bucket (e.g. container) in one region to a bucket in another region. AWS also recently enhanced Elastic Block Storage (EBS) increasing maximum performance and size of Provisioned IOPS (SSD) and General Purpose (SSD) volumes. EBS enhancements included ability to store up to 16 TBytes of data in a single volume and do 20,000 input/output operations per second (IOPS). Read more about EBS and other recent AWS server, storage I/O and application enhancements here.
![]()
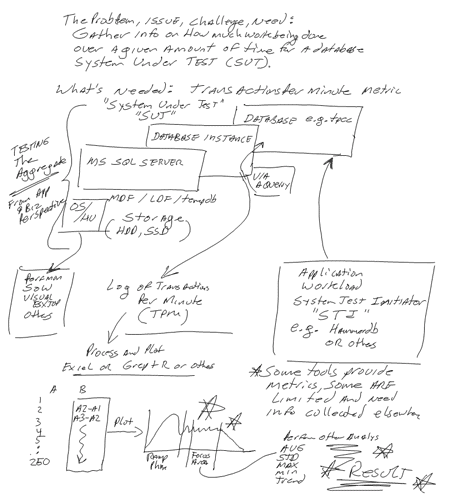
The Problem, Issue, Challenge, Opportunity and Need
The challenge is being able to move data (e.g. objects) stored in AWS buckets in one region to another in a safe, secure, timely, automated, cost-effective way.
Even though AWS has a global name-space, buckets and their objects (e.g. files, data, videos, images, bit and byte streams) are stored in a specific region designated by the customer or user (AWS S3, EBS, EC2, Glacier, Regions and Availability Zone primer can be found here).
Understanding the challenge and designing a strategy
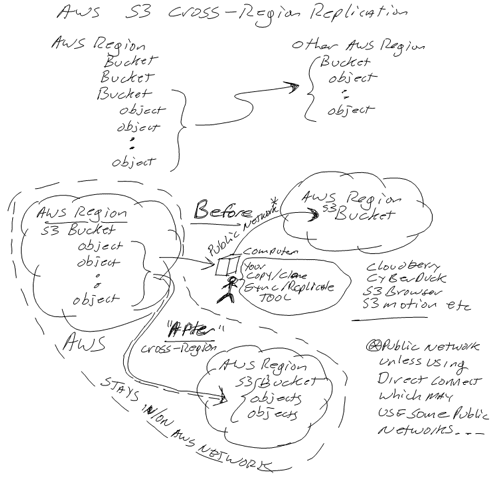
The following diagram shows the challenge and how to copy or replicate objects in an S3 bucket in one region to a destination bucket in a different region. While objects can be copied or replicated without S3 cross-region replication, that involves essentially reading your objects pulling that data out via the internet and then writing to another place. The catch is that this can add extra costs, take time, consume network bandwidth and need extra tools (Cloudberry, Cyberduck, S3fuse, S3motion, S3browser, S3 tools (not AWS) and a long list of others).
What is AWS S3 Cross-region replication
Highlights of AWS S3 Cross-region replication include:
- AWS S3 Cross region replication is as its name implies, replication of S3 objects from a bucket in one region to a destination bucket in another region.
- S3 replication of new objects added to an existing or new bucket (note new objects get replicated)
- Policy based replication tied into S3 versioning and life-cycle rules
- Quick and easy to set up for use in a matter of minutes via S3 dashboard or other interfaces
- Keeps region to region data replication and movement within AWS networks (potential cost advantage)
To activate, you simply enable versioning on a bucket, enable cross-region replication, indicate source bucket (or prefix of objects in bucket), specify destination region and target bucket name (or create one), then create or select an IAM (Identify Access Management) role and objects should be replicated.
- Some AWS S3 cross-region replication things to keep in mind (e.g. considerations):
- As with other forms of mirroring and replication if you add something on one side it gets replicated to other side
- As with other forms of mirroring and replication if you deleted something from the other side it can be deleted on both (be careful and do some testing)
- Keep costs in perspective as you still need to pay for your S3 storage at both locations as well as applicable internal data transfer and GET fees
- Click here to see current AWS S3 fees for various regions
S3 Cross-region replication and alternative approaches
There are several regions around the world and up until today AWS customers could copy, sync or replicate S3 bucket contents between AWS regions manually (or via automation) using various tools such as Cloudberry, Cyberduck, S3browser and S3motion to name just a few as well as via various gateways and other technologies. Some of those tools and technologies are open-source or free, some are freemium and some are premium for a few that also vary by interface (some with GUI, others with CLI or APIs) including ability to mount an S3 bucket as a local network drive and use tools to sync or copy.
However a catch with the above mentioned tools (among others) and approaches is that to replicate your data (e.g. objects in a bucket) can involve other AWS S3 fees. For example reading data (e.g. a GET which has a fee) from one AWS region and then copying out to the internet has fees. Likewise when copying data into another AWS S3 region (e.g. a PUT which are free) there is also the cost of storage at the destination.
AWS S3 cross-region hands on experience (first look)
For my first hands on (first look) experience with AWS cross-region replication today I enabled a bucket in the US Standard region (e.g. Northern Virginia) and created a new target destination bucket in the EU Ireland. Setup and configuration was very quick, literally just a few minutes with most of the time spent reading the text on the new AWS S3 dashboard properties configuration displays.
I selected an existing test bucket to replicate and noticed that nothing had replicated over to the other bucket until I realized that new objects would be replicated. Once some new objects were added to the source bucket within a matter of moments (e.g. few minutes) they appeared across the pond in my EU Ireland bucket. When I deleted those replicated objects from my EU Ireland bucket and switched back to my view of the source bucket in the US, those new objects were already deleted from the source. Yes, just like regular mirroring or replication, pay attention to how you have things configured (e.g. synchronized vs. contribute vs. echo of changes etc.).
While I was not able to do a solid quantifiable performance test, simply based on some quick copies and my network speed moving via S3 cross-region replication was faster than using something like s3motion with my server in the middle.
It also appears from some initial testing today that a benefit of AWS S3 cross-region replication (besides being bundled and part of AWS) is that some fees to pull data out of AWS and transfer out via the internet can be avoided.
![]()
Where to learn more
Here are some links to learn more about AWS S3 and related topics
- Cross-Region Replication for Amazon S3
- Cloud conversations: If focused on cost you might miss other cloud storage benefits
- Data Protection Diaries
- Cloud Conversations: AWS overview and primer
- Eight Ways to Avoid Cloud Storage Pricing Surprises
- Cloud and Object Storage Center
- Are more than five nines of availability really possible?
- How do primary storage clouds and cloud for backup differ?
- What’s most important to know about my cloud privacy policy?
What this all means and wrap-up
For those who are looking for a way to streamline replicating data (e.g. objects) from an AWS bucket in one region with a bucket in a different region you now have a new option. There are potential cost savings if that is your goal along with performance benefits in addition to using what ever might be working in your environment. Replicating objects provides a way of expanding your business continuance (BC), business resiliency (BR) and disaster recovery (DR) involving S3 across regions as well as a means for content cache or distribution among other possible uses.
Overall, I like this ability for moving S3 objects within AWS, however I will continue to use other tools such as S3motion and s3sfs for moving data in and out of AWS as well as among other public cloud serves and local resources.
Ok, nuff said, for now..
Cheers gs
Greg Schulz – Author Cloud and Virtual Data Storage Networking (CRC Press), The Green and Virtual Data Center (CRC Press) and Resilient Storage Networks (Elsevier)
twitter @storageio
All Comments, (C) and (TM) belong to their owners/posters, Other content (C) Copyright 2006-2026 Server StorageIO and UnlimitedIO LLC All Rights Reserved