
Server storage I/O performance benchmark workload scripts Part I

Update 1/28/2018
This is part one of a two-part series of posts about Server storage I/O performance benchmark workload tools and scripts. View part II here which includes the workload scripts and where to view sample results.
There are various tools and workloads for server I/O benchmark testing, validation and exercising different storage devices (or systems and appliances) such as Non-Volatile Memory (NVM) flash Solid State Devices (SSDs) or Hard Disk Drives (HDD) among others.
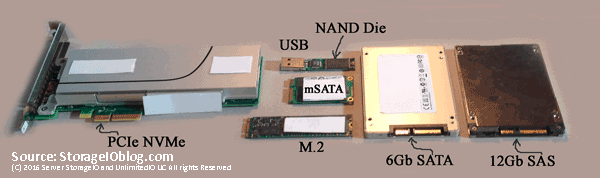
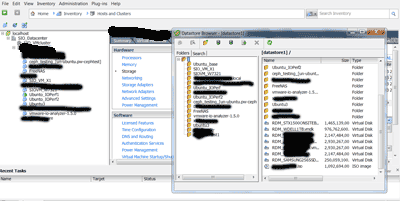
Various NVM flash SSD including NVMe devices
For example, lets say you have an SSD such as an Intel 750 (here, here, and here) or some other vendors NVMe PCIe Add in Card (AiC) installed into a Microsoft Windows server and would like to see how it compares with expected results. The following scripts allow you to validate your system with those of others running the same workload, granted of course your mileage (performance) may vary.

Why Your Performance May Vary
Reasons you performance may vary include among others:
- GHz Speed of your server, number of sockets, cores
- Amount of main DRAM memory
- Number, type and speed of PCIe slots
- Speed of storage device and any adapters
- Device drivers and firmware of storage devices and adapters
- Server power mode setting (e.g. low or balanced power vs. high-performance)
- Other workload running on system and device under test
- Solar flares (kp-index) among other urban (or real) myths and issues
- Typos or misconfiguration of workload test scripts
- Test server, storage, I/O device, software and workload configuration
- Versions of test software tools among others
Windows Power (and performance) Settings
Some things are assumed or taken for granted that everybody knows and does, however sometimes the obvious needs to be stated or re-stated. An example is remembering to check your server power management settings to see if they are in energy efficiency power savings mode, or, in high-performance mode. Note that if your focus is on getting the best possible performance for effective productivity, then you want to be in high performance mode. On the other hand if performance is not your main concern, instead a focus on energy avoidance, then low power mode, or perhaps balanced.
For Microsoft Windows Servers, Desktop Workstations, Laptops and Tablets you can adjust power settings via control panel and GUI as well as command line or Powershell. From command line (privileged or administrator) the following are used for setting balanced or high-performance power settings.
Balanced
powercfg.exe /setactive 381b4222-f694-41f0-9685-ff5bb260df2e
High Performance
powercfg.exe /setactive 8c5e7fda-e8bf-4a96-9a85-a6e23a8c635c
From Powershell the following set balanced or high-performance.
Balanced
PowerCfg -SetActive "381b4222-f694-41f0-9685-ff5bb260df2e"
High Performance
PowerCfg -SetActive "8c5e7fda-e8bf-4a96-9a85-a6e23a8c635c"
Note that you can list Windows power management settings using powercfg -LIST and powercfg -QUERY

Btw, if you have not already done so, enable Windows disk (HDD and SSD) performance counters so that they appear via Task Manager by entering from a command prompt:
diskperf -y
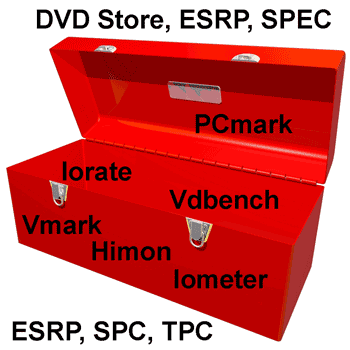
Workload (Benchmark) Simulation Test Tools Used
There are many tools (see storageio.com/performance) that can be used for creating and running workloads just as there are various application server I/O characteristics. Different server I/O and application performance attributes include among others read vs. write, random vs. sequential, large vs. small, long vs. short stride, burst vs. sustain, cache and non-cache friendly, activity vs. data movement vs. latency vs. CPU usage among others. Likewise the number of workers, jobs, threads, outstanding and overlapped I/O among other configuration settings can have an impact on workload and results.
The four free tools that I’m using with this set of scripts are:
- Microsoft Diskspd (free), get the tool and bits here or here (open source), learn more about Diskspd here.
- FIO.exe (free), get the tool and bits here or here among other venues.
- Vdbench (free with registration), get the tool and bits here or here among other venues.
- Iometer (free), get the tool and bits here among other venues.
Notice: While best effort has been made to verify the above links, they may change over time and you are responsible for verifying the safety of links and your downloads.
Where To Learn More
- Part II of this two-part series including sample scripts and results
- How many IOPs can an SSD do?
- Which Enterprise HDDs to use for a content server?
- Learn more about NVM and SSDs at www.thenvmeplace.com and www.thessdplace.com
- Server Storage I/O performance and related tools page
Additional learning experiences along with common questions (and answers), as well as tips can be found in Software Defined Data Infrastructure Essentials book.

What This All Means
Remember, everything is not the same in the data center or with data infrastructures that support different applications.
While some tools are more robust or better than others for different things, ultimately it’s usually not the tool that results in a bad benchmark or comparison, it’s the configuration or lack of including workload settings that are not relevant or applicable. The best benchmark, workload or simulation is your own application. Second best is one that closely resembles your application workload characteristics. A bad benchmark is one that has no relevance to your environment, application use scenario. Take and treat all benchmark or workload simulation results with a grain of salt as something to compare, contrast or make reference to in the proper context. Read part two of this post series to view test tool workload scripts along with sample results.
Ok, nuff said, for now.
Gs
Greg Schulz – Microsoft MVP Cloud and Data Center Management, VMware vExpert 2010-2017 (vSAN and vCloud). Author of Software Defined Data Infrastructure Essentials (CRC Press), as well as Cloud and Virtual Data Storage Networking (CRC Press), The Green and Virtual Data Center (CRC Press), Resilient Storage Networks (Elsevier) and twitter @storageio. Courteous comments are welcome for consideration. First published on https://storageioblog.com any reproduction in whole, in part, with changes to content, without source attribution under title or without permission is forbidden.
All Comments, (C) and (TM) belong to their owners/posters, Other content (C) Copyright 2006-2026 Server StorageIO and UnlimitedIO. All Rights Reserved. StorageIO is a registered Trade Mark (TM) of Server StorageIO.


