SSD, flash, Non-volatile memory (NVM) storage Trends, Tips & Topics

SSD, flash, Non-volatile memory (NVM) storage Trends, Tips & Topics

Updated 2/2/2018

server storage I/O trends

Will 2017 be there year of solid state device (SSD), all flash, or all Non-volatile memory (NVM) based storage data centers and data infrastructures?

Recently I did a piece over at InfoStor looking at SSD trends, tips and related topics. SSDs of some type, shape and form are in your future, if they are not already. In my InfoStor piece, I look at some non-volatile memory (NVM) and SSD trends, technologies, tools and tips that you can leverage today to help prepare for tomorrow. This also includes NVM Express (NVMe) based components and solutions.

By way of background, SSD can refer to solid state drive or solid state device (e.g. more generic). The latter is what I am using in this post. NVM refers to different types of persistent memories, including NAND flash and its variants most commonly used today in SSDs. Other NVM mediums include NVRAM along with storage class memories (SCMs) such as 3D XPoint and phase change memory (PCM) among others. Let’s focus on NAND flash as that is what is primarily available and shipping for production enterprise environments today.

Continue reading about SSD, flash, NVM and related trends, topics and tips over at InfoStor by clicking here.

Where To Learn More

Additional related content can be found at:

What This All Means

Will 2017 finally be the year of all flash, all SSD and all NVM including emerging storage class memories (SCM)? Or as we have seen over the past decade increasing adoption as well as deployment in most environments, some of which have gone all SSD or NVM. In the meantime it is safe to say that NVMe, NVM, SSD, flash and other related technologies are in your future in some shape or form as well as quantity. Check out my piece over at InfoStor SSD trends, tips and related topics.

What say you, are you going all flash, SSD or NVM in 2017, if not, what are your concerns or constraints and plans?

Ok, nuff said, for now…

Cheers
Gs

Greg Schulz – Microsoft MVP Cloud and Data Center Management, vSAN and VMware vExpert. Author Cloud and Virtual Data Storage Networking (CRC Press), The Green and Virtual Data Center (CRC Press) and <a “https://storageioblog.com/book1”>Resilient Storage Networks (Elsevier) and twitter @storageio. Watch for the spring 2017 release of his new book “Software-Defined Data Infrastructure Essentials” (CRC Press).

All Comments, (C) and (TM) belong to their owners/posters, Other content (C) Copyright 2006-2023 Server StorageIO(R) and UnlimitedIO All Rights Reserved

The Value of Infrastructure Insight – Enabling Informed Decision Making

The Value of Infrastructure Insight – Enabling Informed Decision Making

server storage I/O trends

Join me and Virtual Instruments CTO John Gentry on October 27, 2016 for a free webinar (registration required) titled The Value of Infrastructure Insight – Enabling Informed Decision Making with Virtual Instruments. In this webinar, John and me will discuss the value of data center infrastructure insight both as a technology as well as a business and IT imperative.

Software Defined Data Infrastructure
Various Infrastructures – Business, Information, Data and Physical (or cloud)

Leveraging infrastructure performance analytics is key to assuring the performance, availability and cost-effectiveness of your infrastructure, especially as you transform to a hybrid data center over the coming years. By utilizing real-time and historical infrastructure insight from your servers, storage and networking, you can avoid flying blind and give situational awareness for proactive decision-making. The result is faster problem resolution, problem avoidance, higher utilization and the elimination of performance slowdowns and outages.

View the companion Server StorageIO Industry Trends Report available here (free, no registration required) at the Virtual Instruments web page resource center.

xxxx

The above Server StorageIO Industry Trends Perspective Report (click here to download PDF) looks at the value of data center infrastructure insight both as a technology as well as a business productivity enabler. Besides productivity, having insight into how data infrastructure resources (servers, storage, networks, system software) are used, enables informed analysis, troubleshooting, planning, forecasting as well as cost-effective decision-making.

In other words, data center infrastructure insight, based on infrastructure performance analytics, enables you to avoid flying blind, having situational awareness for proactive Information Technology (IT) management. Your return on innovation is increased, and leveraging insight awareness along with metrics that matter drives return on investment (ROI) along with enhanced service delivery.

Where To Learn More

  • Free Server StorageIO Industry Trends Report The Value of Infrastructure Insight – Enabling Informed Decision Making (PDF)
  • Register for the free webinar on October 27, 2016 1PM ET here.
  • View other upcoming and recent events at the Server StorageIO activities page here.

What This All Means

What this all means is that the key to making smart, informed decisions involving data infrastructure, servers, storage, I/O across different applications is having insight and awareness. See for yourself how you can gain insight into your existing information factory environment performing analysis, as well as comparing and simulating your application workloads for informed decision-making.

Having insight and awareness (e.g. instruments) allows you to avoid flying blind, enabling smart, safe and informed decisions in different conditions impacting your data infrastructure. How is your investment in hardware, software, services and tools being leveraged to meet given levels of services? Is your information factory (data center and data infrastructure) performing at its peak effectiveness?

How are you positioned to support growth, improve productivity, remove complexity and costs while evolving from a legacy to a next generation software-defined, cloud, virtual, converged or hyper-converged environment with new application needs?

Data infrastructure insight benefits and takeaways:

  • Informed performance-related decision-making
  • Support growth, agility, flexibility and availability
  • Maximize resource investment and utilization
  • Find, fix and remove I/O bottlenecks
  • Puts you in control in the driver’s seat

Remember to register and attend the October 27 webinar that you can register here.

Btw, Virtual Instruments has been a client of Server StorageIO and that fwiw is a disclosure.

Ok, nuff said, for now…

Cheers
Gs

Greg Schulz – Author Cloud and Virtual Data Storage Networking (CRC Press), The Green and Virtual Data Center (CRC Press) and Resilient Storage Networks (Elsevier)
twitter @storageio

All Comments, (C) and (TM) belong to their owners/posters, Other content (C) Copyright 2006-2023 Server StorageIO(R) and UnlimitedIO All Rights Reserved

Part 2 – Which HDD for Content Applications – HDD Testing

Part 2 – Which HDD for Content Applications – HDD Testing

HDD testing server storage I/O trends

Updated 1/23/2018

Which enterprise HDD to use with a content server, hdd testing, how and what to do

Insight for effective server storage I/O decision making
Server StorageIO Lab Review

Which enterprise HDD to use for content servers

This is the second in a multi-part series (read part one here) based on a white paper hands-on lab report I did compliments of Servers Direct and Seagate that you can read in PDF form here. The focus is looking at the Servers Direct (www.serversdirect.com) converged Content Solution platforms with Seagate Enterprise Hard Disk Drive (HDD’s). In this post we look at some decisions and configuration choices to make for testing content applications servers as well as project planning.

Content Solution Test Objectives

In short period, collect performance and another server, storage I/O decision-making information on various HDD’s running different content workloads.

Working with the Servers Direct staff a suitable content solution platform test configuration was created. In addition to providing two Intel-based content servers, Servers Direct worked with their partner Seagate to arrange for various enterprise-class HDD’s to be evaluated. For these series of content application tests, being short on time, I chose to do run some simple workloads including database, basic file (large and small) processing and general performance characterization.

Content Solution Decision Making

Knowing how Non-Volatile Memory (NVM) NAND flash SSD (1) devices (drives and PCIe cards) perform, what would be the best HDD based storage option for my given set of applications? Different applications have various performance, capacity and budget considerations. Different types of Seagate Enterprise class 2.5” Small Form Factor (SFF) HDD’s were tested.

While revolutions per minute (RPM) still plays a role in HDD performance, there are other factors including internal processing capabilities, software or firmware algorithm optimization, and caching. Most HDD’s today have some amount of DRAM for read caching and other operations. Seagate Enterprise Performance HDD’s with the enhanced caching feature (2) are examples of devices accelerate storage I/O speed vs. traditional 10K and 15K RPM drives.

Project Planning And Preparation

Workload to be tested included:

  • Database read/writes
  • Large file processing
  • Small file processing
  • General I/O profile

Project testing consisted of five phases, some of which overlapped with others:

Phase 1 – Plan
Identify candidate workloads that could be run in the given amount of time, determine time schedules and resource availability, create a project plan.

Phase 2 – Define
Hardware define and software define the test platform.

Phase 3 – Setup
The objective was to assess plug-play capability of the server, storage and I/O networking hardware with a Linux OS before moving on to the reported workloads in the next phase. Initial setup and configuration of hardware and software, installation of additional devices along with software configuration, troubleshooting, and learning as applicable. This phase consisted of using Ubuntu Linux 14.04 server as the operating system (OS) along with MySQL 5.6 as a database server during initial hands-on experience.

Phase 4 – Execute
This consisted of using Windows 2012 R2 server as the OS along with Microsoft SQL Server on the system under test (SUT) to support various workloads. Results of this phase are reported below.

Phase 5 – Analyze      
Results from the workloads run in phase 3 were analyzed and summarized into this document.

(Note 1) Refer to Seagate 1200 12 Gbps Enterprise SAS SSD StorageIO lab review

(Note 2) Refer to Enterprise SSHD and Flash SSD Part of an Enterprise Tiered Storage Strategy

Planning And Preparing The Tests

As with most any project there were constraints to contend with and work around.

Test constraints included:

  • Short-time window
  • Hardware availability
  • Amount of hardware
  • Software availability

Three most important constraints and considerations for this project were:

  • Time – This was a project with a very short time “runway”, something common in most customer environments who are looking to make a knowledgeable server, storage I/O decisions.
  • Amount of hardware – Limited amount of DRAM main memory, sixteen 2.5” internal hot-swap storage slots for HDD’s as well as SSDs. Note that for a production content solution platform; additional DRAM can easily be added, along with extra external storage enclosures to scale memory and storage capacity to fit your needs.
  • Software availability – Utilize common software and management tools publicly available so anybody could leverage those in their own environment and tests.

The following content application workloads were profiled:

  • Database reads/writes – Updates, inserts, read queries for a content environment
  • Large file processing – Streaming of large video, images or other content objects.
  • Small file processing – Processing of many small files found in some content applications
  • General I/O profile – IOP, bandwidth and response time relevant to content applications

Where To Learn More

Additional learning experiences along with common questions (and answers), as well as tips can be found in Software Defined Data Infrastructure Essentials book.

Software Defined Data Infrastructure Essentials Book SDDC

What This All Means

There are many different types of content applications ranging from little data databases to big data analytics as well as very big fast data such as for video. Likewise there are various workloads and characteristics to test. The best test and metrics are those that apply to your environment and application needs.

Continue reading part three of this multi-part series here looking at how the systems and HDD’s were configured and tested.

Ok, nuff said, for now.

Gs

Greg Schulz – Microsoft MVP Cloud and Data Center Management, VMware vExpert 2010-2017 (vSAN and vCloud). Author of Software Defined Data Infrastructure Essentials (CRC Press), as well as Cloud and Virtual Data Storage Networking (CRC Press), The Green and Virtual Data Center (CRC Press), Resilient Storage Networks (Elsevier) and twitter @storageio. Courteous comments are welcome for consideration. First published on https://storageioblog.com any reproduction in whole, in part, with changes to content, without source attribution under title or without permission is forbidden.

All Comments, (C) and (TM) belong to their owners/posters, Other content (C) Copyright 2006-2024 Server StorageIO and UnlimitedIO. All Rights Reserved. StorageIO is a registered Trade Mark (TM) of Server StorageIO.

Part 4 – Which HDD for Content Applications – Database Workloads

Part 4 – Which HDD for Content Applications – Database Workloads

data base server storage I/O trends

Updated 1/23/2018
Which enterprise HDD to use with a content server platform for database workloads

Insight for effective server storage I/O decision making
Server StorageIO Lab Review

Which enterprise HDD to use for content servers

This is the fourth in a multi-part series (read part three here) based on a white paper hands-on lab report I did compliments of Servers Direct and Seagate that you can read in PDF form here. The focus is looking at the Servers Direct (www.serversdirect.com) converged Content Solution platforms with Seagate Enterprise Hard Disk Drive (HDD’s). In this post the focus expands to database application workloads that were run to test various HDD’s.

Database Reads/Writes

Transaction Processing Council (TPC) TPC-C like workloads were run against the SUT from the STI. These workloads simulated transactional, content management, meta-data and key-value processing. Microsoft SQL Server 2012 was configured and used with databases (each 470GB e.g. scale 6000) created and workload generated by virtual users via Dell Benchmark Factory (running on STI Windows 2012 R2).

A single SQL Server database instance (8) was used on the SUT, however unique databases were created for each HDD set being tested. Both the main database file (.mdf) and the log file (.ldf) were placed on the same drive set being tested, keep in mind the constraints mentioned above. As time was a constraint, database workloads were run concurrent (9) with each other except for the Enterprise 10K RAID 1 and RAID 10. Workload was run with two 10K HDD’s in a RAID 1 configuration, then another workload run with a four drive RAID 10. In a production environment, ideally the .mdf and .ldf would be placed on separate HDD’s and SSDs.

To improve cache buffering the SQL Server database instance memory could be increased from 16GB to a larger number that would yield higher TPS numbers. Keep in mind the objective was not to see how fast I could make the databases run, rather how the different drives handled the workload.

(Note 8) The SQL Server Tempdb was placed on a separate NVMe flash SSD, also the database instance memory size was set to 16GB which was shared by all databases and virtual users accessing it.

(Note 9) Each user step was run for 90 minutes with a 30 minute warm-up preamble to measure steady-state operation.

Users

TPCC Like TPS

Single Drive Cost per TPS

Drive Cost per TPS

Single Drive Cost / Per GB Raw Cap.

Cost / Per GB Usable (Protected) Cap.

Drive Cost (Multiple Drives)

Protect
Space Over head

Cost per usable GB per TPS

Resp. Time (Sec.)

ENT 15K R1

1

23.9

$24.94

$49.89

$0.99

$0.99

$1,190

100%

$49.89

0.01

ENT 10K R1

1

23.4

$37.38

$74.77

$0.49

$0.49

$1,750

100%

$74.77

0.01

ENT CAP R1

1

16.4

$24.26

$48.52

$0.20

$0.20

$ 798

100%

$48.52

0.03

ENT 10K R10

1

23.2

$37.70

$150.78

$0.49

$0.97

$3,500

100%

$150.78

0.07

ENT CAP SWR5

1

17.0

$23.45

$117.24

$0.20

$0.25

$1,995

20%

$117.24

0.02

ENT 15K R1

20

362.3

$1.64

$3.28

$0.99

$0.99

$1,190

100%

$3.28

0.02

ENT 10K R1

20

339.3

$2.58

$5.16

$0.49

$0.49

$1,750

100%

$5.16

0.01

ENT CAP R1

20

213.4

$1.87

$3.74

$0.20

$0.20

$ 798

100%

$3.74

0.06

ENT 10K R10

20

389.0

$2.25

$9.00

$0.49

$0.97

$3,500

100%

$9.00

0.02

ENT CAP SWR5

20

216.8

$1.84

$9.20

$0.20

$0.25

$1,995

20%

$9.20

0.06

ENT 15K R1

50

417.3

$1.43

$2.85

$0.99

$0.99

$1,190

100%

$2.85

0.08

ENT 10K R1

50

385.8

$2.27

$4.54

$0.49

$0.49

$1,750

100%

$4.54

0.09

ENT CAP R1

50

103.5

$3.85

$7.71

$0.20

$0.20

$ 798

100%

$7.71

0.45

ENT 10K R10

50

778.3

$1.12

$4.50

$0.49

$0.97

$3,500

100%

$4.50

0.03

ENT CAP SWR5

50

109.3

$3.65

$18.26

$0.20

$0.25

$1,995

20%

$18.26

0.42

ENT 15K R1

100

190.7

$3.12

$6.24

$0.99

$0.99

$1,190

100%

$6.24

0.49

ENT 10K R1

100

175.9

$4.98

$9.95

$0.49

$0.49

$1,750

100%

$9.95

0.53

ENT CAP R1

100

59.1

$6.76

$13.51

$0.20

$0.20

$ 798

100%

$13.51

1.66

ENT 10K R10

100

560.6

$1.56

$6.24

$0.49

$0.97

$3,500

100%

$6.24

0.14

ENT CAP SWR5

100

62.2

$6.42

$32.10

$0.20

$0.25

$1,995

20%

$32.10

1.57

Table-2 TPC-C workload results various number of users across different drive configurations

Figure-2 shows TPC-C TPS (red dashed line) workload scaling over various number of users (1, 20, 50, and 100) with peak TPS per drive shown. Also shown is the used space capacity (in green), with total raw storage capacity in blue cross hatch. Looking at the multiple metrics in context shows that the 600GB Enterprise 15K HDD with performance enhanced cache is a premium option as an alternative, or, to complement flash SSD solutions.

database TPCC transactional workloads
Figure-2 472GB Database TPS scaling along with cost per TPS and storage space used

In figure-2, the 1.8TB Enterprise 10K HDD with performance enhanced cache while not as fast as the 15K, provides a good balance of performance, space capacity and cost effectiveness. A good use for the 10K drives is where some amount of performance is needed as well as a large amount of storage space for less frequently accessed content.

A low cost, low performance option would be the 2TB Enterprise Capacity HDD’s that have a good cost per capacity, however lack the performance of the 15K and 10K drives with enhanced performance cache. A four drive RAID 10 along with a five drive software volume (Microsoft WIndows) are also shown. For apples to apples comparison look at costs vs. capacity including number of drives needed for a given level of performance.

Figure-3 is a variation of figure-2 showing TPC-C TPS (blue bar) and response time (red-dashed line) scaling across 1, 20, 50 and 100 users. Once again the Enterprise 15K with enhanced performance cache feature enabled has good performance in an apples to apples RAID 1 comparison.

Note that the best performance was with the four drive RAID 10 using 10K HDD’s Given popularity, a four drive RAID 10 configuration with the 10K drives was used. Not surprising the four 10K drives performed better than the RAID 1 15Ks. Also note using five drives in a software spanned volume provides a large amount of storage capacity and good performance however with a larger drive footprint.

database TPCC transactional workloads scaling
Figure-3 472GB Database TPS scaling along with response time (latency)

From a cost per space capacity perspective, the Enterprise Capacity drives have a good cost per GB. A hybrid solution for environment that do not need ultra-high performance would be to pair a small amount of flash SSD (10) (drives or PCIe cards), as well as the 10K and 15K performance enhanced drives with the Enterprise Capacity HDD (11) along with cache or tiering software.

(Note 10) Refer to Seagate 1200 12 Gbps Enterprise SAS SSD StorageIO lab review

(Note 11) Refer to Enterprise SSHD and Flash SSD Part of an Enterprise Tiered Storage Strategy

Where To Learn More

Additional learning experiences along with common questions (and answers), as well as tips can be found in Software Defined Data Infrastructure Essentials book.

Software Defined Data Infrastructure Essentials Book SDDC

What This All Means

If your environment is using applications that rely on databases, then test resources such as servers, storage, devices using tools that represent your environment. This means moving up the software and technology stack from basic storage I/O benchmark or workload generator tools such as Iometer among others instead using either your own application, or tools that can replay or generate various workloads that represent your environment.

Continue reading part five in this multi-part series here where the focus shifts to large and small file I/O processing workloads.

Ok, nuff said, for now.

Gs

Greg Schulz – Microsoft MVP Cloud and Data Center Management, VMware vExpert 2010-2017 (vSAN and vCloud). Author of Software Defined Data Infrastructure Essentials (CRC Press), as well as Cloud and Virtual Data Storage Networking (CRC Press), The Green and Virtual Data Center (CRC Press), Resilient Storage Networks (Elsevier) and twitter @storageio. Courteous comments are welcome for consideration. First published on https://storageioblog.com any reproduction in whole, in part, with changes to content, without source attribution under title or without permission is forbidden.

All Comments, (C) and (TM) belong to their owners/posters, Other content (C) Copyright 2006-2024 Server StorageIO and UnlimitedIO. All Rights Reserved. StorageIO is a registered Trade Mark (TM) of Server StorageIO.

Part V – NVMe overview primer (Where to learn more, what this all means)

This is the fifth in a five-part mini-series providing a NVMe primer overview.

View Part I, Part II, Part III, Part IV, Part V as well as companion posts and more NVMe primer material at www.thenvmeplace.com.

There are many different facets of NVMe including protocol that can be deployed on PCIe (AiC, U.2/8639 drives, M.2) for local direct attached, dedicated or shared for front-end or back-end of storage systems. NVMe direct attach is also found in servers and laptops using M.2 NGFF mini cards (e.g. “gum sticks”). In addition to direct attached, dedicated and shared, NVMe is also deployed on fabrics including over Fibre Channel (FC-NVMe) as well as NVMe over Fabrics (NVMeoF) leveraging RDMA based networks (e.g. iWARP, RoCE among others).

The storage I/O capabilities of flash can now be fed across PCIe faster to enable modern multi-core processors to complete more useful work in less time, resulting in greater application productivity. NVMe has been designed from the ground up with more and deeper queues, supporting a larger number of commands in those queues. This in turn enables the SSD to better optimize command execution for much higher concurrent IOPS. NVMe will coexist along with SAS, SATA and other server storage I/O technologies for some time to come. But NVMe will be at the top-tier of storage as it takes full advantage of the inherent speed and low latency of flash while complementing the potential of multi-core processors that can support the latest applications.

With NVMe, the capabilities of underlying NVM and storage memories are further realized Devices used include a PCIe x4 NVMe AiC SSD, 12 GbpsSAS SSD and 6 GbpsSATA SSD. These and other improvements with NVMe enable concurrency while reducing latency to remove server storage I/O traffic congestion. The result is that application demanding more concurrent I/O activity along with lower latency will gravitate towards NVMe for access fast storage.

Like the robust PCIe physical server storage I/O interface it leverages, NVMe provides both flexibility and compatibility. It removes complexity, overhead and latency while allowing far more concurrent I/O work to be accomplished. Those on the cutting edge will embrace NVMe rapidly. Others may prefer a phased approach.

Some environments will initially focus on NVMe for local server storage I/O performance and capacity available today. Other environments will phase in emerging external NVMe flash-based shared storage systems over time.

Planning is an essential ingredient for any enterprise. Because NVMe spans servers, storage, I/O hardware and software, those intending to adopt NVMe need to take into account all ramifications. Decisions made today will have a big impact on future data and information infrastructures.

Key questions should be, how much speed do your applications need now, and how do growth plans affect those requirements? How and where can you maximize your financial return on investment (ROI) when deploying NVMe and how will that success be measured?

Several vendors are working on, or have already introduced NVMe related technologies or initiatives. Keep an eye on among others including AWS, Broadcom (Avago, Brocade), Cisco (Servers), Dell EMC, Excelero, HPE, Intel (Servers, Drives and Cards), Lenovo, Micron, Microsoft (Azure, Drivers, Operating Systems, Storage Spaces), Mellanox, NetApp, OCZ, Oracle, PMC, Samsung, Seagate, Supermicro, VMware, Western Digital (acquisition of SANdisk and HGST) among others.

Where To Learn More

View additional NVMe, SSD, NVM, SCM, Data Infrastructure and related topics via the following links.

Additional learning experiences along with common questions (and answers), as well as tips can be found in Software Defined Data Infrastructure Essentials book.

Software Defined Data Infrastructure Essentials Book SDDC

What this all means

NVMe is in your future if not already, so If NVMe is the answer, what are the questions?

Ok, nuff said, for now.

Gs

Greg Schulz – Microsoft MVP Cloud and Data Center Management, VMware vExpert 2010-2017 (vSAN and vCloud). Author of Software Defined Data Infrastructure Essentials (CRC Press), as well as Cloud and Virtual Data Storage Networking (CRC Press), The Green and Virtual Data Center (CRC Press), Resilient Storage Networks (Elsevier) and twitter @storageio. Courteous comments are welcome for consideration. First published on https://storageioblog.com any reproduction in whole, in part, with changes to content, without source attribution under title or without permission is forbidden.

All Comments, (C) and (TM) belong to their owners/posters, Other content (C) Copyright 2006-2024 Server StorageIO and UnlimitedIO. All Rights Reserved. StorageIO is a registered Trade Mark (TM) of Server StorageIO.

NVMe Need for Performance Speed Performance

server storage I/O trends
Updated 1/12/2018

This is the third in a five-part mini-series providing a primer and overview of NVMe. View companion posts and more material at www.thenvmeplace.com.

How fast is NVMe?

It depends! Generally speaking NVMe is fast!

However fast interfaces and protocols also need fast storage devices, adapters, drivers, servers, operating systems and hypervisors as well as applications that drive or benefit from the increased speed.

A server storage I/O example is in figure 5 where a 6 Gbps SATA NVM flash SSD (left) is shown with an NVMe 8639 (x4) drive that were directly attached to a server. The workload is 8 Kbyte sized random writes with 128 threads (workers) showing results for IOPs (solid bar) along with response time (dotted line). Not surprisingly the NVMe device has a lower response time and a higher number of IOPs. However also note how the amount of CPU time used per IOP is lower on the right with the NVMe drive.

NVMe storage I/O performance
Figure 5 6 Gbps SATA NVM flash SSD vs. NVMe flash SSD

While many people are aware or learning about the IOP and bandwidth improvements as well as the decrease in latency with NVMe, something that gets overlooked is how much less CPU is used. If a server is spending time in wait modes that can result in lost productivity, by finding and removing the barriers more work can be done on a given server, perhaps even delaying a server upgrade.

In figure 5 notice the lower amount of CPU used per work activity being done (e.g. I/O or IOP) which translates to more effective resource use of your server. What that means is either doing more work with what you have, or potentially delaying a CPU server upgrade, or, using those extra CPU cycles to power software defined storage management stacks including erasure coding or advanced parity RAID, replication and other functions.

Table 1 shows relative server I/O performance of some NVM flash SSD devices across various workloads. As with any performance, the comparison takes them, and the following with a grain of salt as your speed will vary.

8KB I/O Size

1MB I/O size

NAND flash SSD

100% Seq. Read

100% Seq. Write

100% Ran. Read

100% Ran. Write

100% Seq. Read

100% Seq. Write

100% Ran. Read

100% Ran. Write

NVMe

IOPs

41829.19

33349.36

112353.6

28520.82

1437.26

889.36

1336.94

496.74

PCIe

Bandwidth

326.79

260.54

877.76

222.82

1437.26

889.36

1336.94

496.74

AiC

Resp.

3.23

3.90

1.30

4.56

178.11

287.83

191.27

515.17

CPU / IOP

0.001571

0.002003

0.000689

0.002342

0.007793

0.011244

0.009798

0.015098

12Gb

IOPs

34792.91

34863.42

29373.5

27069.56

427.19

439.42

416.68

385.9

SAS

Bandwidth

271.82

272.37

229.48

211.48

427.19

429.42

416.68

385.9

Resp.

3.76

3.77

4.56

5.71

599.26

582.66

614.22

663.21

CPU / IOP

0.001857

0.00189

0.002267

0.00229

0.011236

0.011834

0.01416

0.015548

6Gb

IOPs

33861.29

9228.49

28677.12

6974.32

363.25

65.58

356.06

55.86

SATA

Bandwidth

264.54

72.1

224.04

54.49

363.25

65.58

356.06

55.86

Resp.

4.05

26.34

4.67

35.65

704.70

3838.59

718.81

4535.63

CPU / IOP

0.001899

0.002546

0.002298

0.003269

0.012113

0.032022

0.015166

0.046545

Table 1 Relative performance of various protocols and interfaces

The workload results in table 1 were generated using a vdbench script running on a Windows 2012 R2 based server and are intended to be a relative indicator of different protocol and interfaces; your performance mileage will vary. The results shown below compare the number of IOPs (activity rate) for reads, writes, random and sequential across small 8KB and large 1MB sized I/Os.

Also shown in table 1 are bandwidth or throughput (e.g. amount of data moved), response time and the amount of CPU used per IOP. Note in table 1 how NVMe can do higher IOPs with a lower CPU per IOP, or, using a similar amount of CPU, do more work at a lower latency. SSD has been used for decades to help reduce CPU bottlenecks or defer server upgrades by removing I/O wait times and reduce CPU consumption (e.g. wait or lost time).

Can NVMe solutions run faster than those shown above? Absolutely!

Where To Learn More

View additional NVMe, SSD, NVM, SCM, Data Infrastructure and related topics via the following links.

Additional learning experiences along with common questions (and answers), as well as tips can be found in Software Defined Data Infrastructure Essentials book.

Software Defined Data Infrastructure Essentials Book SDDC

What This All Means

Continue reading about NVMe with Part IV (Where and How to use NVMe) in this five-part series, or jump to Part I, Part II or Part V.

Ok, nuff said, for now.

Gs

Greg Schulz – Microsoft MVP Cloud and Data Center Management, VMware vExpert 2010-2017 (vSAN and vCloud). Author of Software Defined Data Infrastructure Essentials (CRC Press), as well as Cloud and Virtual Data Storage Networking (CRC Press), The Green and Virtual Data Center (CRC Press), Resilient Storage Networks (Elsevier) and twitter @storageio. Courteous comments are welcome for consideration. First published on https://storageioblog.com any reproduction in whole, in part, with changes to content, without source attribution under title or without permission is forbidden.

All Comments, (C) and (TM) belong to their owners/posters, Other content (C) Copyright 2006-2024 Server StorageIO and UnlimitedIO. All Rights Reserved. StorageIO is a registered Trade Mark (TM) of Server StorageIO.

EMC DSSD D5 Rack Scale Direct Attached Shared SSD All Flash Array Part I

EMC DSSD D5 Rack Scale Direct Attached Shared SSD All Flash Array Part I

server storage I/O trends

This is the first post in a two-part series pertaining to the EMC DSSD D5 announcement, you can read part two here.

EMC announced today the general availability of their DSSD D5 Shared Direct Attached SSD (DAS) flash storage system (e.g. All Flash Array or AFA) which is a rack-scale solution. If you recall, EMC acquired DSSD back in 2014 which you can read more about here. EMC announced four configurations that include 36TB, 72TB and 144TB raw flash SSD capacity with support for up to 48 dual-ported host client servers.

Via EMC Pulse Blog

What Is DSSD D5

At a high level EMC DSSD D5 is a PCIe direct attached SSD flash storage solution to enable aggregation of disparate SSD card functionality typically found in separate servers into a shared system without causing aggravation. DSSD D5 helps to alleviate server side I/O bottlenecks or aggravation issues that can be the result of aggregation of workloads or data. Think of DSSD D5 as an shared application server storage I/O accelerator for up to 48 servers to access up to 144TB of raw flash SSD to support various applications that have the need for speed.

Applications that have the need for speed or that can benefit from less time waiting for results, where time is money, or boosting productivity can enable high profitability computing. This includes legacy as well as emerging applications and workloads spanning little data, big data and big fast structure and unstructured data. From Oracle to SAS to HBASE and Hadoop among others, perhaps even Alluxio.

Some examples include:

  • Clusters and scale-out grids
  • High Performance COMpute (HPC)
  • Parallel file systems
  • Forecasting and image processing
  • Fraud detection and prevention
  • Research and analytics
  • E-commerce and retail
  • Search and advertising
  • Legacy applications
  • Emerging applications
  • Structured database and key-value repositories
  • Unstructured file systems, HDFS and other data
  • Large undefined work sets
  • From batch stream to real-time
  • Reduces run times from days to hours

Where to learn more

Continue reading with the following links about NVMe, flash SSD and EMC DSSD.

  • Part one of this series here and part two here.
  • Performance Redefined! Introducing DSSD D5 Rack-Scale Flash Solution (EMC Pulse Blog)
  • EMC Unveils DSSD D5: A Quantum Leap In Flash Storage (EMC Press Release)
  • EMC Declares 2016 The “Year of All-Flash” For Primary Storage (EMC Press Release)
  • EMC DSSD D5 Rack-Scale Flash (EMC PDF Overview)
  • EMC DSSD and Cloudera Evolve Hadoop (EMC White Paper Overview)
  • Software Aspects of The EMC DSSD D5 Rack-Scale Flash Storage Platform (EMC PDF White Paper)
  • EMC DSSD D5 (EMC PDF Architecture and Product Specification)
  • EMC VFCache respinning SSD and intelligent caching (Part II)
  • EMC To Acquire DSSD, Inc., Extends Flash Storage Leadership
  • Part II: XtremIO, XtremSW and XtremSF EMC flash ssd portfolio redefined
  • XtremIO, XtremSW and XtremSF EMC flash ssd portfolio redefined
  • Learn more about flash SSD here and NVMe here at thenvmeplace.com
  • What this all means

    Today’s legacy, and emerging applications have the need for speed, and where the applications may not need speed, the users as well as Internet of Things (IoT) that depend upon, or feed those applications do need things to move faster. Fast applications need fast software and hardware to get the same amount of work done faster with less wait delays, as well as process larger amounts of structured and unstructured little data, big data and very fast big data.

    Different applications along with the data infrastructures they rely upon including servers, storage, I/O hardware and software need to adapt to various environments, one size, one approach model does not fit all scenarios. What this means is that some applications and data infrastructures will benefit from shared direct attached SSD storage such as rack scale solutions using EMC DSSD D5. Meanwhile other applications will benefit from AFA or hybrid storage systems along with other approaches used in various ways.

    Continue reading part two of this series here including how EMC DSSD D5 works and more perspectives.

    Ok, nuff said (for now)

    Cheers
    Gs

    Greg Schulz – Author Cloud and Virtual Data Storage Networking (CRC Press), The Green and Virtual Data Center (CRC Press) and Resilient Storage Networks (Elsevier)
    twitter @storageio

    All Comments, (C) and (TM) belong to their owners/posters, Other content (C) Copyright 2006-2023 Server StorageIO(R) and UnlimitedIO All Rights Reserved

    NVMe Place NVM Non Volatile Memory Express Resources

    Updated 8/31/19
    NVMe place server Storage I/O data infrastructure trends

    Welcome to NVMe place NVM Non Volatile Memory Express Resources. NVMe place is about Non Volatile Memory (NVM) Express (NVMe) with Industry Trends Perspectives, Tips, Tools, Techniques, Technologies, News and other information.

    Disclaimer

    Please note that this NVMe place resources site is independent of the industry trade and promoters group NVM Express, Inc. (e.g. www.nvmexpress.org). NVM Express, Inc. is the sole owner of the NVM Express specifications and trademarks.

    NVM Express Organization
    Image used with permission of NVM Express, Inc.

    Visit the NVM Express industry promoters site here to learn more about their members, news, events, product information, software driver downloads, and other useful NVMe resources content.


    The NVMe Place resources and NVM including SCM, PMEM, Flash

    NVMe place includes Non Volatile Memory (NVM) including nand flash, storage class memories (SCM), persistent memories (PM) are storage memory mediums while NVM Express (NVMe) is an interface for accessing NVM. This NVMe resources page is a companion to The SSD Place which has a broader Non Volatile Memory (NVM) focus including flash among other SSD topics. NVMe is a new server storage I/O access method and protocol for fast access to NVM based storage and memory technologies. NVMe is an alternative to existing block based server storage I/O access protocols such as AHCI/SATA and SCSI/SAS devices commonly used for access Hard Disk Drives (HDD) along with SSD among other things.

    Server Storage I/O NVMe PCIe SAS SATA AHCI
    Comparing AHCI/SATA, SCSI/SAS and NVMe all of which can coexist to address different needs.

    Leveraging the standard PCIe hardware interface, NVMe based devices (that have an NVMe controller) can be accessed via various operating systems (and hypervisors such as VMware ESXi) with both in the box drivers or optional third-party device drivers. Devices that support NVMe can be 2.5″ drive format packaged that use a converged 8637/8639 connector (e.g. PCIe x4) coexisting with SAS and SATA devices as well as being add-in card (AIC) PCIe cards supporting x4, x8 and other implementations. Initially, NVMe is being positioned as a back-end to servers (or storage systems) interface for accessing fast flash and other NVM based devices.

    NVMe as back-end storage
    NVMe as a “back-end” I/O interface for NVM storage media

    NVMe as front-end server storage I/O interface
    NVMe as a “front-end” interface for servers or storage systems/appliances

    NVMe has also been shown to work over low latency, high-speed RDMA based network interfaces including RoCE (RDMA over Converged Ethernet) and InfiniBand (read more here, here and here involving Mangstor, Mellanox and PMC among others). What this means is that like SCSI based SAS which can be both a back-end drive (HDD, SSD, etc) access protocol and interface, NVMe can also being used for back-end can also be used as a front-end of server to storage interface like how Fibre Channel SCSI_Protocol (aka FCP), SCSI based iSCSI, SCSI RDMA Protocol via InfiniBand (among others) are used.

    NVMe features

    Main features of NVMe include among others:

    • Lower latency due to improve drivers and increased queues (and queue sizes)
    • Lower CPU used to handle larger number of I/Os (more CPU available for useful work)
    • Higher I/O activity rates (IOPs) to boost productivity unlock value of fast flash and NVM
    • Bandwidth improvements leveraging various fast PCIe interface and available lanes
    • Dual-pathing of devices like what is available with dual-path SAS devices
    • Unlock the value of more cores per processor socket and software threads (productivity)
    • Various packaging options, deployment scenarios and configuration options
    • Appears as a standard storage device on most operating systems
    • Plug-play with in-box drivers on many popular operating systems and hypervisors

    Shared external PCIe using NVMe
    NVMe and shared PCIe (e.g. shared PCIe flash DAS)

    NVMe related content and links

    The following are some of my tips, articles, blog posts, presentations and other content, along with material from others pertaining to NVMe. Keep in mind that the question should not be if NVMe is in your future, rather when, where, with what, from whom and how much of it will be used as well as how it will be used.

    • How to Prepare for the NVMe Server Storage I/O Wave (Via Micron.com)
    • Why NVMe Should Be in Your Data Center (Via Micron.com)
    • NVMe U2 (8639) vs. M2 interfaces (Via Gamersnexus)
    • Enmotus FuzeDrive MicroTiering (StorageIO Lab Report)
    • EMC DSSD D5 Rack Scale Direct Attached Shared SSD All Flash Array Part I (Via StorageIOBlog)
    • Part II – EMC DSSD D5 Direct Attached Shared AFA (Via StorageIOBlog)
    • NAND, DRAM, SAS/SCSI & SATA/AHCI: Not Dead, Yet! (Via EnterpriseStorageForum)
    • Non Volatile Memory (NVM), NVMe, Flash Memory Summit and SSD updates (Via StorageIOblog)
    • Microsoft and Intel showcase Storage Spaces Direct with NVM Express at IDF ’15 (Via TechNet)
    • MNVM Express solutions (Via SuperMicro)
    • Gaining Server Storage I/O Insight into Microsoft Windows Server 2016 (Via StorageIOblog)
    • PMC-Sierra Scales Storage with PCIe, NVMe (Via EEtimes)
    • RoCE updates among other items (Via InfiniBand Trade Association (IBTA) December Newsletter)
    • NVMe: The Golden Ticket for Faster Flash Storage? (Via EnterpriseStorageForum)
    • What should I consider when using SSD cloud? (Via SearchCloudStorage)
    • MSP CMG, Sept. 2014 Presentation (Flash back to reality – Myths and Realities – Flash and SSD Industry trends perspectives plus benchmarking tips)– PDF
    • Selecting Storage: Start With Requirements (Via NetworkComputing)
    • PMC Announces Flashtec NVMe SSD NVMe2106, NVMe2032 Controllers With LDPC (Via TomsITpro)
    • Exclusive: If Intel and Micron’s “Xpoint” is 3D Phase Change Memory, Boy Did They Patent It (Via Dailytech)
    • Intel & Micron 3D XPoint memory — is it just CBRAM hyped up? Curation of various posts (Via Computerworld)
    • How many IOPS can a HDD, HHDD or SSD do (Part I)?
    • How many IOPS can a HDD, HHDD or SSD do with VMware? (Part II)
    • I/O Performance Issues and Impacts on Time-Sensitive Applications (Via CMG)
    • Via EnterpriseStorageForum: 5 Hot Storage Technologies to Watch
    • Via EnterpriseStorageForum: 10-Year Review of Data Storage

    Non-Volatile Memory (NVM) Express (NVMe) continues to evolve as a technology for enabling and improving server storage I/O for NVM including nand flash SSD storage. NVMe streamline performance enabling more work to be done (e.g. IOPs), data to be moved (bandwidth) at a lower response time using less CPU.

    NVMe and SATA flash SSD performance

    The above figure is a quick look comparing nand flash SSD being accessed via SATA III (6Gbps) on the left and NVMe (x4) on the right. As with any server storage I/O performance comparisons there are many variables and take them with a grain of salt. While IOPs and bandwidth are often discussed, keep in mind that with the new protocol, drivers and device controllers with NVMe that streamline I/O less CPU is needed.

    Additional NVMe Resources

    Also check out the Server StorageIO companion micro sites landing pages including thessdplace.com (SSD focus), data protection diaries (backup, BC/DR/HA and related topics), cloud and object storage, and server storage I/O performance and benchmarking here.

    If you are in to the real bits and bytes details such as at device driver level content check out the Linux NVMe reflector forum. The linux-nvme forum is a good source if you are developer to stay up on what is happening in and around device driver and associated topics.

    Additional learning experiences along with common questions (and answers), as well as tips can be found in Software Defined Data Infrastructure Essentials book.

    Software Defined Data Infrastructure Essentials Book SDDC

    Disclaimer

    Disclaimer: Please note that this site is independent of the industry trade and promoters group NVM Express, Inc. (e.g. www.nvmexpress.org). NVM Express, Inc. is the sole owner of the NVM Express specifications and trademarks. Check out the NVM Express industry promoters site here to learn more about their members, news, events, product information, software driver downloads, and other useful NVMe resources content.

    NVM Express Organization
    Image used with permission of NVM Express, Inc.

    Wrap Up

    Watch for updates with more content, links and NVMe resources to be added here soon.

    Ok, nuff said (for now)

    Cheers
    Gs

    Greg Schulz – Microsoft MVP Cloud and Data Center Management, VMware vExpert 2010-2017 (vSAN and vCloud). Author of Software Defined Data Infrastructure Essentials (CRC Press), as well as Cloud and Virtual Data Storage Networking (CRC Press), The Green and Virtual Data Center (CRC Press), Resilient Storage Networks (Elsevier) and twitter @storageio. Courteous comments are welcome for consideration. First published on https://storageioblog.com any reproduction in whole, in part, with changes to content, without source attribution under title or without permission is forbidden.

    All Comments, (C) and (TM) belong to their owners/posters, Other content (C) Copyright 2006-2024 Server StorageIO and UnlimitedIO. All Rights Reserved. StorageIO is a registered Trade Mark (TM) of Server StorageIO.

    Collecting Transaction Per Minute from SQL Server and HammerDB

    Storage I/O trends

    Collecting Transaction Per Minute from SQL Server and HammerDB

    When using benchmark or workload generation tools such as HammerDB I needed a way to capture and log performance activity metrics such as transactions per minute. For example using HammerDB to simulate an application making database requests performing various transactions as part of testing an overall system solution including server and storage I/O activity. This post takes a look at the problem or challenge I was looking to address, as well as creating a solution after spending time searching for one (still searching btw).

    The Problem, Issue, Challenge, Opportunity and Need

    The challenge is to collect application performance such as transactions per minute from a workload using a database. The workload or benchmark tool (in this case HammerDB) is the System Test Initiator (STI) that drives the activity (e.g. database requests) to a System Under Test (SUT). In this example the SUT is a Microsoft SQL Server running on a Windows 2012 R2 server. What I need is to collect and log into a file for later analysis the transaction rate per minute while the STI is generating a particular workload.

    Server Storage I/O performance

    Understanding the challenge and designing a strategy

    If you have ever used benchmark or workload generation tools such as Quest Benchmark Factory (part of the Toad tools collection) you might be spoiled with how it can be used to not only generate the workload, as well as collect, process, present and even store the results for database workloads such as TPC simulations. In this situation, Transaction Processing Council (TPC) like workloads need to be run and metrics on performance collected. Lets leave Benchmark Factory for a future discussion and focus instead on a free tool called HammerDB and more specifically how to collection transactions per minute metrics from Microsoft SQL Server. While the focus is SQL Server, you can easily adapt the approach for MySQL among others, not to mention there are tools such as Sysbench, Aerospike among other tools.

    The following image (created using my Livescribe Echo digital pen) outlines the problem, as well as sketches out a possible solution design. In the following figure, for my solution I’m going to show how to grab every minute for a given amount of time the count of transactions that have occurred. Later in the post processing (you could also do in the SQL Script) I take the new transaction count (which is cumulative) and subtract the earlier interval which yields the transactions per minute (see examples later in this post).

    collect TPM metrics from SQL Server with hammerdb
    The problem and challenge, a way to collect Transactions Per Minute (TPM)

    Finding a solution

    HammerDB displays results via its GUI, and perhaps there is a way or some trick to get it to log results to a file or some other means, however after searching the web, found that it was quicker to come up with solution. That solution was to decide how to collect and report the transactions per minute (or you could do by second or other interval) from Microsoft SQL Server. The solution was to find what performance counters and metrics are available from SQL Server, how to collect those and log them to a file for processing. What this means is a SQL Server script file would need to be created that ran in a loop collecting for a given amount of time at a specified interval. For example once a minute for several hours.

    Taking action

    The following is a script that I came up with that is far from optimal however it gets the job done and is a starting point for adding more capabilities or optimizations.

    In the following example, set loopcount to some number of minutes to collect samples for. Note however that if you are running a workload test for eight (8) hours with a 30 minute ramp-up time, you would want to use a loopcount (e.g. number of minutes to collect for) of 480 + 30 + 10. The extra 10 minutes is to allow for some samples before the ramp and start of workload, as well as to give a pronounced end of test number of samples. Add or subtract however many minutes to collect for as needed, however keep this in mind, better to collect a few extra minutes vs. not have them and wished you did.

    -- Note and disclaimer:
    -- 
    -- Use of this code sample is at your own risk with Server StorageIO and UnlimitedIO LLC
    -- assuming no responsibility for its use or consequences. You are free to use this as is
    -- for non-commercial scenarios with no warranty implied. However feel free to enhance and
    -- share those enhancements with others e.g. pay it forward.
    -- 
    DECLARE @cntr_value bigint;
    DECLARE @loopcount bigint; # how many minutes to take samples for
    
    set @loopcount = 240
    
    SELECT @cntr_value = cntr_value
     FROM sys.dm_os_performance_counters
     WHERE counter_name = 'transactions/sec'
     AND object_name = 'MSSQL$DBIO:Databases'
     AND instance_name = 'tpcc' ; print @cntr_value;
     WAITFOR DELAY '00:00:01'
    -- 
    -- Start loop to collect TPM every minute
    -- 
    
    while @loopcount <> 0
    begin
    SELECT @cntr_value = cntr_value
     FROM sys.dm_os_performance_counters
     WHERE counter_name = 'transactions/sec'
     AND object_name = 'MSSQL$DBIO:Databases'
     AND instance_name = 'tpcc' ; print @cntr_value;
     WAITFOR DELAY '00:01:00'
     set @loopcount = @loopcount - 1
    end
    -- 
    -- All done with loop, write out the last value
    -- 
    SELECT @cntr_value = cntr_value
     FROM sys.dm_os_performance_counters
     WHERE counter_name = 'transactions/sec'
     AND object_name = 'MSSQL$DBIO:Databases'
     AND instance_name = 'tpcc' ; print @cntr_value;
    -- 
    -- End of script
    -- 

    The above example has loopcount set to 240 for a 200 minute test with a 30 minute ramp and 10 extra minutes of samples. I use the a couple of the minutes to make sure that the system test initiator (STI) such as HammerDB is configured and ready to start executing transactions. You could also put this along with your HammerDB items into a script file for further automation, however I will leave that exercise up to you.

    For those of you familiar with SQL and SQL Server you probably already see some things to improve or stylized or simply apply your own preference which is great, go for it. Also note that I’m only selecting a certain variable from the performance counters as there are many others which you can easily discovery with a couple of SQL commands (e.g. select and specify database instance and object name. Also note that the key is accessing the items in sys.dm_os_performance_counters of your SQL Server database instance.

    The results

    The output from the above is a list of cumulative numbers as shown below which you will need to post process (or add a calculation to the above script). Note that part of running the script is specifying an output file which I show later.

    785
    785
    785
    785
    37142
    1259026
    2453479
    3635138
    

    Implementing the solution

    You can setup the above script to run as part of a larger automation shell or batch script, however for simplicity I’m showing it here using Microsoft SQL Server Studio.

    SQL Server script to collect TPM
    Microsoft SQL Server Studio with script to collect Transaction Per Minute (TPM)

    The following image shows how to specify an output file for the results to be logged to when using Microsoft SQL Studio to run the TPM collection script.

    Specify SQL Server tpm output file
    Microsoft SQL Server Studio specify output file

    With the SQL Server script running to collect results, and HammerDB workload running to generate activity, the following shows Quest Spotlight on Windows (SoW) displaying WIndows Server 2012 R2 operating system level performance including CPU, memory, paging and other activity. Note that this example had about the system test initiator (STI) which is HammerDB and the system under test (SUT) that is Microsoft SQL Server on the same server.

    Spotlight on Windows while SQL Server doing tpc
    Quest Spotlight on Windows showing Windows Server performance activity

    Results and post-processing

    As part of post processing simple use your favorite tool or script or what I often do is pull the numbers into Excel spreadsheet, and simply create a new column of numbers that computes and shows the difference between each step (see below). While in Excel then I plot the numbers as needed which can also be done via a shell script and other plotting tools such as R.

    In the following example, the results are imported into Excel (your favorite tool or script) where I then add a column (B) that simple computes the difference between the existing and earlier counter. For example in cell B2 = A2-A1, B3 = A3-A2 and so forth for the rest of the numbers in column A. I then plot the numbers in column B to show the transaction rates over time that can then be used for various things.

    Hammerdb TPM results from SQL Server processed in Excel
    Results processed in Excel and plotted

    Note that in the above results that might seem too good to be true they are, these were cached results to show the tools and data collection process as opposed to the real work being done, at least for now…

    Where to learn more

    Here are some extra links to have a look at:

    How to test your HDD, SSD or all flash array (AFA) storage fundamentals
    Server and Storage I/O Benchmarking 101 for Smarties
    Server and Storage I/O Benchmark Tools: Microsoft Diskspd (Part I)
    The SSD Place (collection of flash and SSD resources)
    Server and Storage I/O Benchmarking and Performance Resources
    I/O, I/O how well do you know about good or bad server and storage I/Os?

    What this all means and wrap-up

    There are probably many ways to fine tune and optimize the above script, likewise there may even be some existing tool, plug-in, add-on module, or configuration setting that allows HammerDB to log the transaction activity rates to a file vs. simply showing on a screen. However for now, this is a work around that I have found for when needing to collect transaction activity performance data with HammerDB and SQL Server.

    Ok, nuff said, for now…

    Cheers gs

    Greg Schulz – Author Cloud and Virtual Data Storage Networking (CRC Press), The Green and Virtual Data Center (CRC Press) and Resilient Storage Networks (Elsevier)
    twitter @storageio

    All Comments, (C) and (TM) belong to their owners/posters, Other content (C) Copyright 2006-2024 Server StorageIO and UnlimitedIO LLC All Rights Reserved

    How to test your HDD SSD or all flash array (AFA) storage fundamentals

    How to test your HDD SSD AFA Hybrid or cloud storage

    server storage data infrastructure i/o hdd ssd all flash array afa fundamentals

    Updated 2/14/2018

    Over at BizTech Magazine I have a new article 4 Ways to Performance Test Your New HDD or SSD that provides a quick guide to verifying or learning what the speed characteristic of your new storage device are capable of.

    An out-take from the article used by BizTech as a "tease" is:

    These four steps will help you evaluate new storage drives. And … psst … we included the metrics that matter.

    Building off the basics, server storage I/O benchmark fundamentals

    The four basic steps in the article are:

    • Plan what and how you are going to test (what’s applicable for you)
    • Decide on a benchmarking tool (learn about various tools here)
    • Test the test (find bugs, errors before a long running test)
    • Focus on metrics that matter (what’s important for your environment)

    Server Storage I/O performance

    Where To Learn More

    View additional NAS, NVMe, SSD, NVM, SCM, Data Infrastructure and HDD related topics via the following links.

    Additional learning experiences along with common questions (and answers), as well as tips can be found in Software Defined Data Infrastructure Essentials book.

    Software Defined Data Infrastructure Essentials Book SDDC

    What This All Means

    To some the above (read the full article here) may seem like common sense tips and things everybody should know otoh there are many people who are new to servers storage I/O networking hardware software cloud virtual along with various applications, not to mention different tools.

    Thus the above is a refresher for some (e.g. Dejavu) while for others it might be new and revolutionary or simply helpful. Interested in HDD’s, SSD’s as well as other server storage I/O performance along with benchmarking tools, techniques and trends check out the collection of links here (Server and Storage I/O Benchmarking and Performance Resources).

    Ok, nuff said, for now.

    Gs

    Greg Schulz – Microsoft MVP Cloud and Data Center Management, VMware vExpert 2010-2017 (vSAN and vCloud). Author of Software Defined Data Infrastructure Essentials (CRC Press), as well as Cloud and Virtual Data Storage Networking (CRC Press), The Green and Virtual Data Center (CRC Press), Resilient Storage Networks (Elsevier) and twitter @storageio. Courteous comments are welcome for consideration. First published on https://storageioblog.com any reproduction in whole, in part, with changes to content, without source attribution under title or without permission is forbidden.

    All Comments, (C) and (TM) belong to their owners/posters, Other content (C) Copyright 2006-2024 Server StorageIO and UnlimitedIO. All Rights Reserved. StorageIO is a registered Trade Mark (TM) of Server StorageIO.

    February 2015 Server StorageIO Update Newsletter

    Volume 15, Issue II

    Hello and welcome to this February 2015 Server and StorageIO update newsletter. The new year is off and running with many events already underway including the recent USENIX FAST conference and others on the docket over the next few months.

    Speaking of FAST (File and Storage Technologies) event which I attended last week, here is a link to where you can download the conference proceedings.

    In other events, VMware announced version 6 of their vSphere ESXi hypervisor and associated management tools including VSAN, VVOL among other items.

    This months newsletter has a focus on server storage I/O performance topics with various articles, tips, commentary and blog posts.

    Watch for more news, updates and industry trends perspectives coming soon.

    Commentary In The News

    StorageIO news

    Following are some StorageIO industry trends perspectives comments that have appeared in various print and on-line venues. Over at Processor there are comments on resilient & highly available, underutilized or unused servers, what abandoned data Is costing your company, align application needs with your infrastructure (server, storage, networking) resources.

    Also at processor explore flash based (SSD) storage, enterprise backup buying tips, re-evaluate server security, new tech advancements for server upgrades, and understand cost of acquiring storage.

    Meanwhile over at CyberTrend there are some perspectives on enterprise backup and better servers mean better business.

    View more trends comments here

    Tips and Articles

    So you have a new storage device or system.

    How will you test or find its performance?

    Check out this quick-read tip on storage benchmark and testing fundamentals over at BizTech. Also check out these resources and links on server storage I/O performance and benchmarking tools.

    View recent as well as past tips and articles here

    StorageIOblog posts

    Recent StorageIOblog posts include:

    View other recent as well as past blog posts here

    In This Issue

  • Industry Trends Perspectives
  • Commentary in the news
  • Tips and Articles
  • StorageIOblog posts
  • Events & Activities

    EMCworld – May 4-6 2015

    Interop – April 29 2015

    NAB – April 14-15 2015

    Deltaware Event – March 3 2015

    Feb. 18 – FAST 2015 – Santa Clara CA

    View other recent and upcoming events here

    Webinars

    December 11, 2014 – BrightTalk
    Server & Storage I/O Performance

    December 10, 2014 – BrightTalk
    Server & Storage I/O Decision Making

    December 9, 2014 – BrightTalk
    Virtual Server and Storage Decision Making

    December 3, 2014 – BrightTalk
    Data Protection Modernization

    November 13 9AM PT – BrightTalk
    Software Defined Storage

    Videos and Podcasts

    StorageIO podcasts are also available via and at StorageIO.tv

    From StorageIO Labs

    Research, Reviews and Reports

    StarWind Virtual SAN
    starwind virtual san

    Using less hardware with software defined storage management. This looks at the needs of Microsoft Hyper-V ROBO and SMB environments with software defined storage less hardware. Read more here.

    View other StorageIO lab review reports here.

    Resources and Links

    Check out these useful links and pages:
    storageio.com/links
    objectstoragecenter.com
    storageioblog.com/data-protection-diaries-main/

    storageperformance.us
    thessdplace.com
    storageio.com/raid
    storageio.com/ssd

    Enjoy this edition of the Server and StorageIO update newsletter and watch for new tips, articles, StorageIO lab report reviews, blog posts, videos and podcasts along with in the news commentary appearing soon.

    Cheers gs

    Greg Schulz – Author Cloud and Virtual Data Storage Networking (CRC Press), The Green and Virtual Data Center (CRC Press) and Resilient Storage Networks (Elsevier)
    twitter @storageio

    All Comments, (C) and (TM) belong to their owners/posters, Other content (C) Copyright 2006-2024 Server StorageIO and UnlimitedIO LLC All Rights Reserved

    Server and Storage I/O Benchmarking 101 for Smarties

    Server Storage I/O Benchmarking 101 for Smarties or dummies ;)

    server storage I/O trends

    This is the first of a series of posts and links to resources on server storage I/O performance and benchmarking (view more and follow-up posts here).

    The best I/O is the I/O that you do not have to do, the second best is the one with the least impact as well as low overhead.

    server storage I/O performance

    Drew Robb (@robbdrew) has a Data Storage Benchmarking Guide article over at Enterprise Storage Forum that provides a good framework and summary quick guide to server storage I/O benchmarking.

    Via Drew:

    Data storage benchmarking can be quite esoteric in that vast complexity awaits anyone attempting to get to the heart of a particular benchmark.

    Case in point: The Storage Networking Industry Association (SNIA) has developed the Emerald benchmark to measure power consumption. This invaluable benchmark has a vast amount of supporting literature. That so much could be written about one benchmark test tells you just how technical a subject this is. And in SNIA’s defense, it is creating a Quick Reference Guide for Emerald (coming soon).

    But rather than getting into the nitty-gritty nuances of the tests, the purpose of this article is to provide a high-level overview of a few basic storage benchmarks, what value they might have and where you can find out more. 

    Read more here including some of my comments, tips and recommendations.

    Drew’s provides a good summary and overview in his article which is a great opener for this first post in a series on server storage I/O benchmarking and related resources.

    You can think of this series (along with Drew’s article) as server storage I/O benchmarking fundamentals (e.g. 101) for smarties (e.g. non-dummies ;) ).

    Note that even if you are not a server, storage or I/O expert, you can still be considered a smarty vs. a dummy if you found the need or interest to read as well as learn more about benchmarking, metrics that matter, tools, technology and related topics.

    Server and Storage I/O benchmarking 101

    There are different reasons for benchmarking, such as, you might be asked or want to know how many IOPs per disk, Solid State Device (SSD), device or storage system such as for a 15K RPM (revolutions per minute) 146GB SAS Hard Disk Drive (HDD). Sure you can go to a manufactures website and look at the speeds and feeds (technical performance numbers) however are those metrics applicable to your environments applications or workload?

    You might get higher IOPs with smaller IO size on sequential reads vs. random writes which will also depend on what the HDD is attached to. For example are you going to attach the HDD to a storage system or appliance with RAID and caching? Are you going to attach the HDD to a PCIe RAID card or will it be part of a server or storage system. Or are you simply going to put the HDD into a server or workstation and use as a drive without any RAID or performance acceleration.

    What this all means is understanding what it is that you want to benchmark test to learn what the system, solution, service or specific device can do under different workload conditions.

    Some benchmark and related topics include

    • What are you trying to benchmark
    • Why do you need to benchmark something
    • What are some server storage I/O benchmark tools
    • What is the best benchmark tool
    • What to benchmark, how to use tools
    • What are the metrics that matter
    • What is benchmark context why does it matter
    • What are marketing hero benchmark results
    • What to do with your benchmark results
    • server storage I/O benchmark step test
      Example of a step test results with various workers and workload

    • What do the various metrics mean (can we get a side of context with them metrics?)
    • Why look at server CPU if doing storage and I/O networking tests
    • Where and how to profile your application workloads
    • What about physical vs. virtual vs. cloud and software defined benchmarking
    • How to benchmark block DAS or SAN, file NAS, object, cloud, databases and other things
    • Avoiding common benchmark mistakes
    • Tips, recommendations, things to watch out for
    • What to do next

    server storage I/O trends

    Where to learn more

    The following are related links to read more about server (cloud, virtual and physical) storage I/O benchmarking tools, technologies and techniques.

    Drew Robb’s benchmarking quick reference guide
    Server storage I/O benchmarking tools, technologies and techniques resource page
    Server and Storage I/O Benchmarking 101 for Smarties.
    Microsoft Diskspd download and Microsoft Diskspd overview (via Technet)
    I/O, I/O how well do you know about good or bad server and storage I/Os?
    Server and Storage I/O Benchmark Tools: Microsoft Diskspd (Part I and Part II)

    Wrap up and summary

    We have just scratched the surface when it comes to benchmarking cloud, virtual and physical server storage I/O and networking hardware, software along with associated tools, techniques and technologies. However hopefully this and the links for more reading mentioned above give a basis for connecting the dots of what you already know or enable learning more about workloads, synthetic generation and real-world workloads, benchmarks and associated topics. Needless to say there are many more things that we will cover in future posts (e.g. keep an eye on and bookmark the server storage I/O benchmark tools and resources page here).

    Ok, nuff said, for now…

    Cheers gs

    Greg Schulz – Author Cloud and Virtual Data Storage Networking (CRC Press), The Green and Virtual Data Center (CRC Press) and Resilient Storage Networks (Elsevier)
    twitter @storageio

    All Comments, (C) and (TM) belong to their owners/posters, Other content (C) Copyright 2006-2024 Server StorageIO and UnlimitedIO LLC All Rights Reserved

    Server Storage I/O Benchmark Tools: Microsoft Diskspd (Part I)

    Server Storage I/O Benchmark Tools: Microsoft Diskspd (Part I)

    server storage I/O trends

    This is part-one of a two-part post pertaining Microsoft Diskspd.that is also part of a broader series focused on server storage I/O benchmarking, performance, capacity planning, tools and related technologies. You can view part-two of this post here, along with companion links here.

    Background

    Many people use Iometer for creating synthetic (artificial) workloads to support benchmarking for testing, validation and other activities. While Iometer with its GUI is relatively easy to use and available across many operating system (OS) environments, the tool also has its limits. One of the bigger limits for Iometer is that it has become dated with little to no new development for a long time, while other tools including some new ones continue to evolve in functionality, along with extensibility. Some of these tools have optional GUI for easy of use or configuration, while others simple have extensive scripting and command parameter capabilities. Many tools are supported across different OS including physical, virtual and cloud, while others such as Microsoft Diskspd are OS specific.

    Instead of focusing on Iometer and other tools as well as benchmarking techniques (we cover those elsewhere), lets focus on Microsoft Diskspd.


    server storage I/O performance

    What is Microsoft Diskspd?

    Microsoft Diskspd is a synthetic workload generation (e.g. benchmark) tool that runs on various Windows systems as an alternative to Iometer, vdbench, iozone, iorate, fio, sqlio among other tools. Diskspd is a command line tool which means it can easily be scripted to do reads and writes of various I/O size including random as well as sequential activity. Server and storage I/O can be buffered file system as well non-buffered across different types of storage and interfaces. Various performance and CPU usage information is provided to gauge the impact on a system when doing a given number of IOP’s, amount of bandwidth along with response time latency.

    What can Diskspd do?

    Microsoft Diskspd creates synthetic benchmark workload activity with ability to define various options to simulate different application characteristics. This includes specifying read and writes, random, sequential, IO size along with number of threads to simulate concurrent activity. Diskspd can be used for testing or validating server and storage I/O systems along with associated software, tools and components. In addition to being able to specify different workloads, Diskspd can also be told which processors to use (e.g. CPU affinity), buffering or non-buffered IO among other things.

    What type of storage does Diskspd work with?

    Physical and virtual storage including hard disk drive (HDD), solid state devices (SSD), solid state hybrid drives (SSHD) in various systems or solutions. Storage can be physical as well as partitions or file systems. As with any workload tool when doing writes, exercise caution to prevent accidental deletion or destruction of your data.


    What information does Diskspd produce?

    Diskspd provides output in text as well as XML formats. See an example of Diskspd output further down in this post.

    Where to get Diskspd?

    You can download your free copy of Diskspd from the Microsoft site here.

    The download and installation are quick and easy, just remember to select the proper version for your Windows system and type of processor.

    Another tip is to remember to set path environment variables point to where you put the Diskspd image.

    Also stating what should be obvious, don’t forget that if you are going to be doing any benchmark or workload generation activity on a system where the potential for a data to be over-written or deleted, make sure you have a good backup and tested restore before you begin, if something goes wrong.


    New to server storage I/O benchmarking or tools?

    If you are not familiar with server storage I/O performance benchmarking or using various workload generation tools (e.g. benchmark tools), Drew Robb (@robbdrew) has a Data Storage Benchmarking Guide article over at Enterprise Storage Forum that provides a good framework and summary quick guide to server storage I/O benchmarking.


    Via Drew:

    Data storage benchmarking can be quite esoteric in that vast complexity awaits anyone attempting to get to the heart of a particular benchmark.

    Case in point: The Storage Networking Industry Association (SNIA) has developed the Emerald benchmark to measure power consumption. This invaluable benchmark has a vast amount of supporting literature. That so much could be written about one benchmark test tells you just how technical a subject this is. And in SNIA’s defense, it is creating a Quick Reference Guide for Emerald (coming soon).


    But rather than getting into the nitty-gritty nuances of the tests, the purpose of this article is to provide a high-level overview of a few basic storage benchmarks, what value they might have and where you can find out more. 

    Read more here including some of my comments, tips and recommendations.


    In addition to Drew’s benchmarking quick reference guide, along with the server storage I/O benchmarking tools, technologies and techniques resource page (Server and Storage I/O Benchmarking 101 for Smarties.

    How do you use Diskspd?


    Tip: When you run Microsoft Diskspd it will create a file or data set on the device or volume being tested that it will do its I/O to, make sure that you have enough disk space for what will be tested (e.g. if you are going to test 1TB you need to have more than 1TB of disk space free for use). Another tip is to speed up the initializing (e.g. when Diskspd creates the file that I/Os will be done to) run as administrator.

    Tip: In case you forgot, a couple of other useful Microsoft tools (besides Perfmon) for working with and displaying server storage I/O devices including disks (HDD and SSDs) are the commands "wmic diskdrive list [brief]" and "diskpart". With diskpart exercise caution as it can get you in trouble just as fast as it can get you out of trouble.

    You can view the Diskspd commands after installing the tool and from a Windows command prompt type:

    C:\Users\Username> Diskspd


    The above command will display Diskspd help and information about the commands as follows.

    Usage: diskspd [options] target1 [ target2 [ target3 …] ]
    version 2.0.12 (2014/09/17)

    Available targets:
    file_path
    # :

    Available options:


    -?display usage information
    -a#[,#[…]]advanced CPU affinity – affinitize threads to CPUs provided after -a in a round-robin manner within current KGroup (CPU count starts with 0); the same CPU can be listed more than once and the number of CPUs can be different than the number of files or threads (cannot be used with -n)

    -ag

    group affinity – affinitize threads in a round-robin manner across KGroups
    -b[K|M|G]block size in bytes/KB/MB/GB [default=64K]

    -B[K|M|G|b]

    base file offset in bytes/KB/MB/GB/blocks [default=0] (offset from the beginning of the file)
    -c[K|M|G|b]create files of the given size. Size can be stated in bytes/KB/MB/GB/blocks

    -Ccool down time – duration of the test after measurements finished [default=0s].

    -DPrint IOPS standard deviations. The deviations are calculated for samples of duration . is given in milliseconds and the default value is 1000.
    -dduration (in seconds) to run test [default=10s]
    -f[K|M|G|b]

    file size – this parameter can be used to use only the part of the file/disk/partition for example to test only the first sectors of disk
    -fropen file with the FILE_FLAG_RANDOM_ACCESS hint
    -fsopen file with the FILE_FLAG_SEQUENTIAL_SCAN hint
    -Ftotal number of threads (cannot be used with -t)
    -gthroughput per thread is throttled to given bytes per millisecond note that this can not be specified when using completion routines
    -hdisable both software and hardware caching
    -inumber of IOs (burst size) before thinking. must be specified with -j
    -jtime to think in ms before issuing a burst of IOs (burst size). must be specified with -i
    -ISet IO priority to . Available values are: 1-very low, 2-low, 3-normal (default)
    -lUse large pages for IO buffers

    -Lmeasure latency statistics
    -ndisable affinity (cannot be used with -a)
    -onumber of overlapped I/O requests per file per thread (1=synchronous I/O, unless more than 1 thread is specified with -F) [default=2]
    -pstart async (overlapped) I/O operations with the same offset (makes sense only with -o2 or grater)
    -Penable printing a progress dot after each completed I/O operations (counted separately by each thread) [default count=65536]
    -r[K|M|G|b]random I/O aligned to bytes (doesn’t make sense with -s). can be stated in bytes/KB/MB/GB/blocks [default access=sequential, default alignment=block size]
    -R

    output format. Default is text.
    -s[K|M|G|b]stride size (offset between starting positions of subsequent I/O operations)
    -Sdisable OS caching
    -tnumber of threads per file (cannot be used with -F)
    -T[K|M|G|b]stride between I/O operations performed on the same file by different threads [default=0] (starting offset = base file offset + (thread number * ) it makes sense only with -t or -F
    -vverbose mode
    -wpercentage of write requests (-w and -w0 are equivalent). absence of this switch indicates 100% reads IMPORTANT: Your data will be destroyed without a warning
    -W

    warm up time – duration of the test before measurements start [default=5s].
    -xuse completion routines instead of I/O Completion Ports
    -Xuse an XML file for configuring the workload. Cannot be used with other parameters.
    -zset random seed [default=0 if parameter not provided, GetTickCount() if value not provided]


    Write buffers command options. By default, the write buffers are filled with a repeating pattern (0, 1, 2, …, 255, 0, 1, …)
    -Z

    zero buffers used for write tests
    -Z[K|M|G|b]use a global buffer filled with random data as a source for write operations.
    -Z[K|M|G|b],

    use a global buffer filled with data from as a source for write operations. If is smaller than , its content will be repeated multiple times in the buffer. By default, the write buffers are filled with a repeating pattern (0, 1, 2, …, 255, 0, 1, …)


     Synchronization command options
    -ys
    signals event
    before starting the actual run (no warmup) (creates a notification event if does not exist)
    -yfsignals event after the actual run finishes (no cooldown) (creates a notification event if does not exist)
    -yrwaits on event before starting the run (including warmup) (creates a notification event if does not exist)
    -ypallows to stop the run when event is set; it also binds CTRL+C to this event (creates a notification event if does not exist)
    -yesets event and quits


    Event Tracing command options

    -epuse paged memory for NT Kernel Logger (by default it uses non-paged memory)
    -equse perf timer
    -esuse system timer (default)
    -ecuse cycle count
    -ePROCESSprocess start & end
    -eTHREADthread start & end
    -eIMAGE_LOADimage load
    -eDISK_IOphysical disk IO
    -eMEMORY_PAGE_FAULTSall page faults
    -eMEMORY_HARD_FAULTShard faults only
    -eNETWORK

    TCP/IP, UDP/IP send & receive
    -eREGISTRYregistry calls


    Examples:

    Create 8192KB file and run read test on it for 1 second:

    diskspd -c8192K -d1 testfile.dat

    Set block size to 4KB, create 2 threads per file, 32 overlapped (outstanding)
    I/O operations per thread, disable all caching mechanisms and run block-aligned random
    access read test lasting 10 seconds:

    diskspd -b4K -t2 -r -o32 -d10 -h testfile.dat

    Create two 1GB files, set block size to 4KB, create 2 threads per file, affinitize threads
    to CPUs 0 and 1 (each file will have threads affinitized to both CPUs) and run read test
    lasting 10 seconds:

    diskspd -c1G -b4K -t2 -d10 -a0,1 testfile1.dat testfile2.dat

    Where to learn more


    The following are related links to read more about servver (cloud, virtual and physical) storage I/O benchmarking tools, technologies and techniques.
    resource page

    Server and Storage I/O Benchmarking 101 for Smarties.

    Microsoft Diskspd download and Microsoft Diskspd overview (via Technet)

    I/O, I/O how well do you know about good or bad server and storage I/Os?

    Server and Storage I/O Benchmark Tools: Microsoft Diskspd (Part I and Part II)

    Wrap up and summary, for now…


    This wraps up part-one of this two-part post taking a look at Microsoft Diskspd benchmark and workload generation tool. In part-two (here) of this post series we take a closer look including a test drive using Microsoft Diskspd.

    Ok, nuff said (for now)

    Cheers gs

    Greg Schulz – Author Cloud and Virtual Data Storage Networking (CRC Press), The Green and Virtual Data Center (CRC Press) and Resilient Storage Networks (Elsevier)

    twitter @storageio


    All Comments, (C) and (TM) belong to their owners/posters, Other content (C) Copyright 2006-2024 Server StorageIO and UnlimitedIO LLC All Rights Reserved

    Microsoft Diskspd (Part II): Server Storage I/O Benchmark Tools

    Microsoft Diskspd (Part II): Server Storage I/O Benchmark Tools

    server storage I/O trends

    This is part-two of a two-part post pertaining Microsoft Diskspd.that is also part of a broader series focused on server storage I/O benchmarking, performance, capacity planning, tools and related technologies. You can view part-one of this post here, along with companion links here.

    Microsoft Diskspd StorageIO lab test drive
    Server and StorageIO lab

    Talking about tools and technologies is one thing, installing as well as trying them is the next step for gaining experience so how about some quick hands-on time with Microsoft Diskspd (download your copy here).

    The following commands all specify an I/O size of 8Kbytes doing I/O to a 45GByte file called diskspd.dat located on the F: drive. Note that a 45GByte file is on the small size for general performance testing, however it was used for simplicity in this example. Ideally a larger target storage area (file, partition, device) would be used, otoh, if your application uses a small storage device or volume, then tune accordingly.

    In this test, the F: drive is an iSCSI RAID protected volume, however you could use other storage interfaces supported by Windows including other block DAS or SAN (e.g. SATA, SAS, USB, iSCSI, FC, FCoE, etc) as well as NAS. Also common to the following commands is using 16 threads and 32 outstanding I/Os to simulate concurrent activity of many users, or application processing threads.
    server storage I/O performance
    Another common parameter used in the following was -r for random, 7200 seconds (e.g. two hour) test duration time, display latency ( -L ) disable hardware and software cache ( -h), forcing cpu affinity (-a0,1,2,3). Since the test ran on a server with four cores I wanted to see if I could use those for helping to keep the threads and storage busy. What varies in the commands below is the percentage of reads vs. writes, as well as the results output file. Some of the workload below also had the -S option specified to disable OS I/O buffering (to view how buffering helps when enabled or disabled). Depending on the goal, or type of test, validation, or workload being run, I would choose to set some of these parameters differently.

    diskspd -c45g -b8K -t16 -o32 -r -d7200 -h -w0 -L -a0,1,2,3 F:\diskspd.dat >> SIOWS2012R203_Eiscsi_145_noh_write000.txt

    diskspd -c45g -b8K -t16 -o32 -r -d7200 -h -w50 -L -a0,1,2,3 F:\diskspd.dat >> SIOWS2012R203_Eiscsi_145_noh_write050.txt

    diskspd -c45g -b8K -t16 -o32 -r -d7200 -h -w100 -L -a0,1,2,3 F:\diskspd.dat >> SIOWS2012R203_Eiscsi_145_noh_write100.txt

    diskspd -c45g -b8K -t16 -o32 -r -d7200 -h -S -w0 -L -a0,1,2,3 F:\diskspd.dat >> SIOWS2012R203_Eiscsi_145_noSh_test_write000.txt

    diskspd -c45g -b8K -t16 -o32 -r -d7200 -h -S -w50 -L -a0,1,2,3 F:\diskspd.dat >> SIOWS2012R203_Eiscsi_145_noSh_write050.txt

    diskspd -c45g -b8K -t16 -o32 -r -d7200 -h -S -w100 -L -a0,1,2,3 F:\diskspd.dat >> SIOWS2012R203_Eiscsi_145_noSh_write100.txt

    The following is the output from the above workload command.
    Microsoft Diskspd sample output
    Microsoft Diskspd sample output part 2
    Microsoft Diskspd sample output part 3

    Note that as with any benchmark, workload test or simulation your results will vary. In the above the server, storage and I/O system were not tuned as the focus was on working with the tool, determining its capabilities. Thus do not focus on the performance results per say, rather what you can do with Diskspd as a tool to try different things. Btw, fwiw, in the above example in addition to using an iSCSI target, the Windows 2012 R2 server was a guest on a VMware ESXi 5.5 system.

    Where to learn more

    The following are related links to read more about server (cloud, virtual and physical) storage I/O benchmarking tools, technologies and techniques.

    Drew Robb’s benchmarking quick reference guide
    Server storage I/O benchmarking tools, technologies and techniques resource page
    Server and Storage I/O Benchmarking 101 for Smarties.
    Microsoft Diskspd download and Microsoft Diskspd overview (via Technet)
    I/O, I/O how well do you know about good or bad server and storage I/Os?
    Server and Storage I/O Benchmark Tools: Microsoft Diskspd (Part I and Part II)

    Comments and wrap-up

    What I like about Diskspd (Pros)

    Reporting including CPU usage (you can’t do server and storage I/O without CPU) along with IOP’s (activity), bandwidth (throughout or amount of data being moved), per thread and total results along with optional reporting. While a GUI would be nice particular for beginners, I’m used to setting up scripts for different workloads so having an extensive options for setting up different workloads is welcome. Being associated with a specific OS (e.g. Windows) the CPU affinity and buffer management controls will be handy for some projects.

    Diskspd has the flexibility to use different storage interfaces and types of storage including files or partitions should be taken for granted, however with some tools don’t take things for granted. I like the flexibility to easily specify various IO sizes including large 1MByte, 10MByte, 20MByte, 100MByte and 500MByte to simulate application workloads that do large sequential (or random) activity. I tried some IO sizes (e.g. specified by -b parameter larger than 500MB however, I received various errors including "Could not allocate a buffer bytes for target" which means that Diskspd can do IO sizes smaller than that. While not able to do IO sizes larger than 500MB, this is actually impressive. Several other tools I have used or with have IO size limits down around 10MByte which makes it difficult for creating workloads that do large IOP’s (note this is the IOP size, not the number of IOP’s).

    Oh, something else that should be obvious however will state it, Diskspd is free unlike some industry de-facto standard tools or workload generators that need a fee to get and use.

    Where Diskspd could be improved (Cons)

    For some users a GUI or configuration wizard would make the tool easier to get started with, on the other hand (oth), I tend to use the command capabilities of tools. Would also be nice to specify ranges as part of a single command such as stepping through an IO size range (e.g. 4K, 8K, 16K, 1MB, 10MB) as well as read write percentages along with varying random sequential mixes. Granted this can easily be done by having a series of commands, however I have become spoiled by using other tools such as vdbench.

    Summary
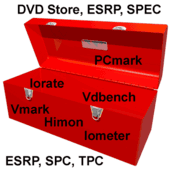
    Server and storage I/O performance toolbox

    Overall I like Diskspd and have added it to my Server Storage I/O workload and benchmark tool-box

    Keep in mind that the best benchmark or workload generation technology tool will be your own application(s) configured to run as close as possible to production activity levels.

    However when that is not possible, the an alternative is to use tools that have the flexibility to be configured as close as possible to your application(s) workload characteristics. This means that the focus should not be as much on the tool, as opposed to how flexible is a tool to work for you, granted the tool needs to be robust.

    Having said that, Microsoft Diskspd is a good and extensible tool for benchmarking, simulation, validation and comparisons, however it will only be as good as the parameters and configuration you set it up to use.

    Check out Microsoft Diskspd and add it to your benchmark and server storage I/O tool-box like I have done.

    Ok, nuff said (for now)

    Cheers gs

    Greg Schulz – Author Cloud and Virtual Data Storage Networking (CRC Press), The Green and Virtual Data Center (CRC Press) and Resilient Storage Networks (Elsevier)
    twitter @storageio

    All Comments, (C) and (TM) belong to their owners/posters, Other content (C) Copyright 2006-2024 Server StorageIO and UnlimitedIO LLC All Rights Reserved