Server Storage I/O Benchmark Performance Resource Tools

Server Storage I/O Benchmarking Performance Resource Tools

server storage I/O trends

Updated 1/23/2018

Server storage I/O benchmark performance resource tools, various articles and tips. These include tools for legacy, virtual, cloud and software defined environments.

benchmark performance resource tools server storage I/O performance

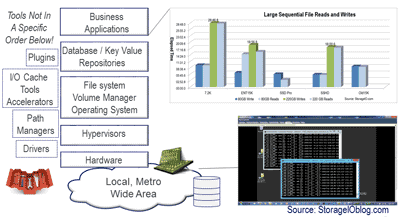
The best server and storage I/O (input/output operation) is the one that you do not have to do, the second best is the one with the least impact.

server storage I/O locality of reference

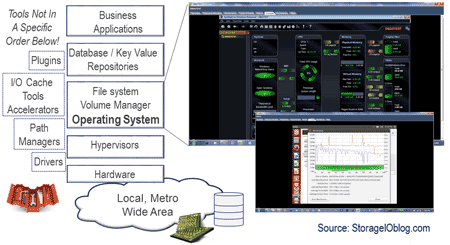
This is where the idea of locality of reference (e.g. how close is the data to where your application is running) comes into play which is implemented via tiered memory, storage and caching shown in the figure above.

Cloud virtual software defined storage I/O

Server storage I/O performance applies to cloud, virtual, software defined and legacy environments

What this has to do with server storage I/O (and networking) performance benchmarking is keeping the idea of locality of reference, context and the application workload in perspective regardless of if cloud, virtual, software defined or legacy physical environments.

StorageIOblog: I/O, I/O how well do you know about good or bad server and storage I/Os?
StorageIOblog: Server and Storage I/O benchmarking 101 for smarties
StorageIOblog: Which Enterprise HDDs to use for a Content Server Platform (7 part series with using benchmark tools)
StorageIO.com: Enmotus FuzeDrive MicroTiering lab test using various tools
StorageIOblog: Some server storage I/O benchmark tools, workload scripts and examples (Part I) and (Part II)
StorageIOblog: Get in the NVMe SSD game (if you are not already)
Doridmen.com: Transcend SSD360S Review with tips on using ATTO and Crystal benchmark tools
ComputerWeekly: Storage performance metrics: How suppliers spin performance specifications

Via StorageIO Podcast: Kevin Closson discusses SLOB Server CPU I/O Database Performance benchmarks
Via @KevinClosson: SLOB Use Cases By Industry Vendors. Learn SLOB, Speak The Experts’ Language
Via BeyondTheBlocks (Reduxio): 8 Useful Tools for Storage I/O Benchmarking
Via CCSIObench: Cold-cache Sequential I/O Benchmark
Doridmen.com: Transcend SSD360S Review with tips on using ATTO and Crystal benchmark tools
CISJournal: Benchmarking the Performance of Microsoft Hyper-V server, VMware ESXi and Xen Hypervisors (PDF)
Microsoft TechNet:Windows Server 2016 Hyper-V large-scale VM performance for in-memory transaction processing
InfoStor: What’s The Best Storage Benchmark?
StorageIOblog: How to test your HDD, SSD or all flash array (AFA) storage fundamentals
Via ATTO: Atto V3.05 free storage test tool available
Via StorageIOblog: Big Files and Lots of Little File Processing and Benchmarking with Vdbench

Via StorageIO.com: Which Enterprise Hard Disk Drives (HDDs) to use with a Content Server Platform (White Paper)
Via VMware Blogs: A Free Storage Performance Testing Tool For Hyperconverged
Microsoft Technet: Test Storage Spaces Performance Using Synthetic Workloads in Windows Server
Microsoft Technet: Microsoft Windows Server Storage Spaces – Designing for Performance
BizTech: 4 Ways to Performance-Test Your New HDD or SSD
EnterpriseStorageForum: Data Storage Benchmarking Guide
StorageSearch.com: How fast can your SSD run backwards?
OpenStack: How to calculate IOPS for Cinder Storage ?
StorageAcceleration: Tips for Measuring Your Storage Acceleration

server storage I/O STI and SUT

Spiceworks: Determining HDD SSD SSHD IOP Performance
Spiceworks: Calculating IOPS from Perfmon data
Spiceworks: profiling IOPs

vdbench server storage I/O benchmark
Vdbench example via StorageIOblog.com

StorageIOblog: What does server storage I/O scaling mean to you?
StorageIOblog: What is the best kind of IO? The one you do not have to do
Testmyworkload.com: Collect and report various OS workloads
Whoishostingthis: Various SQL resources
StorageAcceleration: What, When, Why & How to Accelerate Storage
Filesystems.org: Various tools and links
StorageIOblog: Can we get a side of context with them IOPS and other storage metrics?

flash ssd and hdd

BrightTalk Webinar: Data Center Monitoring – Metrics that Matter for Effective Management
StorageIOblog: Enterprise SSHD and Flash SSD Part of an Enterprise Tiered Storage Strategy
StorageIOblog: Has SSD put Hard Disk Drives (HDD’s) On Endangered Species List?

server storage I/O bottlenecks and I/O blender

Microsoft TechNet: Measuring Disk Latency with Windows Performance Monitor (Perfmon)
Via Scalegrid.io: How to benchmark MongoDB with YCSB? (Perfmon)
Microsoft MSDN: List of Perfmon counters for sql server
Microsoft TechNet: Taking Your Server’s Pulse
StorageIOblog: Part II: How many IOPS can a HDD, HHDD or SSD do with VMware?
CMG: I/O Performance Issues and Impacts on Time-Sensitive Applications

flash ssd and hdd

Virtualization Practice: IO IO it is off to Storage and IO metrics we go
InfoStor: Is HP Short Stroking for Performance and Capacity Gains?
StorageIOblog: Is Computer Data Storage Complex? It Depends
StorageIOblog: More storage and IO metrics that matter
StorageIOblog: Moving Beyond the Benchmark Brouhaha
Yellow-Bricks: VSAN VDI Benchmarking and Beta refresh!

server storage I/O benchmark example

YellowBricks: VSAN performance: many SAS low capacity VS some SATA high capacity?
YellowBricsk: VSAN VDI Benchmarking and Beta refresh!
StorageIOblog: Seagate 1200 12Gbs Enterprise SAS SSD StorgeIO lab review
StorageIOblog: Part II: Seagate 1200 12Gbs Enterprise SAS SSD StorgeIO lab review
StorageIOblog: Server Storage I/O Network Benchmark Winter Olympic Games

flash ssd and hdd

VMware VDImark aka View Planner (also here, here and here) as well as VMmark here
StorageIOblog: SPC and Storage Benchmarking Games
StorageIOblog: Speaking of speeding up business with SSD storage
StorageIOblog: SSD and Storage System Performance

Hadoop server storage I/O performance
Various Server Storage I/O tools in a hadoop environment

Michael-noll.com: Benchmarking and Stress Testing an Hadoop Cluster With TeraSort, TestDFSIO
Virtualization Practice: SSD options for Virtual (and Physical) Environments Part I: Spinning up to speed on SSD
StorageIOblog: Storage and IO metrics that matter
InfoStor: Storage Metrics and Measurements That Matter: Getting Started
SilvertonConsulting: Storage throughput vs. IO response time and why it matters
Splunk: The percentage of Read / Write utilization to get to 800 IOPS?

flash ssd and hdd
Various server storage I/O benchmarking tools

Spiceworks: What is the best IO IOPs testing tool out there
StorageIOblog: How many IOPS can a HDD, HHDD or SSD do?
StorageIOblog: Some Windows Server Storage I/O related commands
Openmaniak: Iperf overview and Iperf.fr: Iperf overview
StorageIOblog: Server and Storage I/O Benchmark Tools: Microsoft Diskspd (Part I and Part II)
Quest: SQL Server Perfmon Poster (PDF)
Server and Storage I/O Networking Performance Management (webinar)
Data Center Monitoring – Metrics that Matter for Effective Management (webinar)
Flash back to reality – Flash SSD Myths and Realities (Industry trends & benchmarking tips), (MSP CMG presentation)
DBAstackexchange: How can I determine how many IOPs I need for my AWS RDS database?
ITToolbox: Benchmarking the Performance of SANs

server storage IO labs

StorageIOblog: Dell Inspiron 660 i660, Virtual Server Diamond in the rough (Server review)
StorageIOblog: Part II: Lenovo TS140 Server and Storage I/O Review (Server review)
StorageIOblog: DIY converged server software defined storage on a budget using Lenovo TS140
StorageIOblog: Server storage I/O Intel NUC nick knack notes First impressions (Server review)
StorageIOblog & ITKE: Storage performance needs availability, availability needs performance
StorageIOblog: Why SSD based arrays and storage appliances can be a good idea (Part I)
StorageIOblog: Revisiting RAID storage remains relevant and resources

Interested in cloud and object storage visit our objectstoragecenter.com page, for flash SSD checkout storageio.com/ssd page, along with data protection, RAID, various industry links and more here.

Additional learning experiences along with common questions (and answers), as well as tips can be found in Software Defined Data Infrastructure Essentials book.

Software Defined Data Infrastructure Essentials Book SDDC

What This All Means

Watch for additional links to be added above in addition to those that appear via comments.

Ok, nuff said, for now.

Gs

Greg Schulz – Microsoft MVP Cloud and Data Center Management, VMware vExpert 2010-2017 (vSAN and vCloud). Author of Software Defined Data Infrastructure Essentials (CRC Press), as well as Cloud and Virtual Data Storage Networking (CRC Press), The Green and Virtual Data Center (CRC Press), Resilient Storage Networks (Elsevier) and twitter @storageio. Courteous comments are welcome for consideration. First published on https://storageioblog.com any reproduction in whole, in part, with changes to content, without source attribution under title or without permission is forbidden.

All Comments, (C) and (TM) belong to their owners/posters, Other content (C) Copyright 2006-2024 Server StorageIO and UnlimitedIO. All Rights Reserved. StorageIO is a registered Trade Mark (TM) of Server StorageIO.

I/O, I/O how well do you know good bad ugly server storage I/O iops?

How well do you know good bad ugly I/O iops?

server storage i/o iops activity data infrastructure trends

Updated 2/10/2018

There are many different types of server storage I/O iops associated with various environments, applications and workloads. Some I/Os activity are iops, others are transactions per second (TPS), files or messages per time (hour, minute, second), gets, puts or other operations. The best IO is one you do not have to do.

What about all the cloud, virtual, software defined and legacy based application that still need to do I/O?

If no IO operation is the best IO, then the second best IO is the one that can be done as close to the application and processor as possible with the best locality of reference.

Also keep in mind that aggregation (e.g. consolidation) can cause aggravation (server storage I/O performance bottlenecks).

aggregation causes aggravation
Example of aggregation (consolidation) causing aggravation (server storage i/o blender bottlenecks)

And the third best?

It’s the one that can be done in less time or at least cost or effect to the requesting application, which means moving further down the memory and storage stack.

solving server storage i/o blender and other bottlenecks
Leveraging flash SSD and cache technologies to find and fix server storage I/O bottlenecks

On the other hand, any IOP regardless of if for block, file or object storage that involves some context is better than those without, particular involving metrics that matter (here, here and here [webinar] )

Server Storage I/O optimization and effectiveness

The problem with IO’s is that they are a basic operations to get data into and out of a computer or processor, so there’s no way to avoid all of them, unless you have a very large budget. Even if you have a large budget that can afford an all flash SSD solution, you may still meet bottlenecks or other barriers.

IO’s require CPU or processor time and memory to set up and then process the results as well as IO and networking resources to move data too their destination or retrieve them from where they are stored. While IO’s cannot be eliminated, their impact can be greatly improved or optimized by, among other techniques, doing fewer of them via caching and by grouping reads or writes (pre-fetch, write-behind).

server storage I/O STI and SUT

Think of it this way: Instead of going on multiple errands, sometimes you can group multiple destinations together making for a shorter, more efficient trip. However, that optimization may also mean your drive will take longer. So, sometimes it makes sense to go on a couple of quick, short, low-latency trips instead of one larger one that takes half a day even as it accomplishes many tasks. Of course, how far you have to go on those trips (i.e., their locality) makes a difference about how many you can do in a given amount of time.

Locality of reference (or proximity)

What is locality of reference?

This refers to how close (i.e., its place) data exists to where it is needed (being referenced) for use. For example, the best locality of reference in a computer would be registers in the processor core, ready to be acted on immediately. This would be followed by levels 1, 2, and 3 (L1, L2, and L3) onboard caches, followed by main memory, or DRAM. After that comes solid-state memory typically NAND flash either on PCIe cards or accessible on a direct attached storage (DAS), SAN, or NAS device. 

server storage I/O locality of reference

Even though a PCIe NAND flash card is close to the processor, there still remains the overhead of traversing the PCIe bus and associated drivers. To help offset that impact, PCIe cards use DRAM as cache or buffers for data along with meta or control information to further optimize and improve locality of reference. In other words, this information is used to help with cache hits, cache use, and cache effectiveness vs. simply boosting cache use.

SSD to the rescue?

What can you do the cut the impact of IO’s?

There are many steps one can take, starting with establishing baseline performance and availability metrics.

The metrics that matter include IOP’s, latency, bandwidth, and availability. Then, leverage metrics to gain insight into your application’s performance.

Understand that IO’s are a fact of applications doing work (storing, retrieving, managing data) no matter whether systems are virtual, physical, or running up in the cloud. But it’s important to understand just what a bad IO is, along with its impact on performance. Try to identify those that are bad, and then find and fix the problem, either with software, application, or database changes. Perhaps you need to throw more software caching tools, hypervisors, or hardware at the problem. Hardware may include faster processors with more DRAM and faster internal busses.

Leveraging local PCIe flash SSD cards for caching or as targets is another option.

You may want to use storage systems or appliances that rely on intelligent caching and storage optimization capabilities to help with performance, availability, and capacity.

Where to gain insight into your server storage I/O environment

There are many tools that you can be used to gain insight into your server storage I/O environment across cloud, virtual, software defined and legacy as well as from different layers (e.g. applications, database, file systems, operating systems, hypervisors, server, storage, I/O networking). Many applications along with databases have either built-in or optional tools from their provider, third-party, or via other sources that can give information about work activity being done. Likewise there are tools to dig down deeper into the various data information infrastructure to see what is happening at the various layers as shown in the following figures.

application storage I/O performance
Gaining application and operating system level performance insight via different tools

windows and linux storage I/O performance
Insight and awareness via operating system tools on Windows and Linux

In the above example, Spotlight on Windows (SoW) which you can download for free from Dell here along with Ubuntu utilities are shown, You could also use other tools to look at server storage I/O performance including Windows Perfmon among others.

vmware server storage I/O
Hypervisor performance using VMware ESXi / vsphere built-in tools

vmware server storage I/O performance
Using Visual ESXtop to dig deeper into virtual server storage I/O performance

vmware server storage i/o cache
Gaining insight into virtual server storage I/O cache performance

Wrap up and summary

There are many approaches to address (e.g. find and fix) vs. simply move or mask data center and server storage I/O bottlenecks. Having insight and awareness into how your environment along with applications is important to know to focus resources. Also keep in mind that a bit of flash SSD or DRAM cache in the applicable place can go along way while a lot of cache will also cost you cash. Even if you cant eliminate I/Os, look for ways to decrease their impact on your applications and systems.

Where To Learn More

View additional NAS, NVMe, SSD, NVM, SCM, Data Infrastructure and HDD related topics via the following links.

Additional learning experiences along with common questions (and answers), as well as tips can be found in Software Defined Data Infrastructure Essentials book.

Software Defined Data Infrastructure Essentials Book SDDC

What This All Means

>Keep in mind: SSD including flash and DRAM among others are in your future, the question is where, when, with what, how much and whose technology or packaging.

Ok, nuff said, for now.

Gs

Greg Schulz – Microsoft MVP Cloud and Data Center Management, VMware vExpert 2010-2017 (vSAN and vCloud). Author of Software Defined Data Infrastructure Essentials (CRC Press), as well as Cloud and Virtual Data Storage Networking (CRC Press), The Green and Virtual Data Center (CRC Press), Resilient Storage Networks (Elsevier) and twitter @storageio. Courteous comments are welcome for consideration. First published on https://storageioblog.com any reproduction in whole, in part, with changes to content, without source attribution under title or without permission is forbidden.

All Comments, (C) and (TM) belong to their owners/posters, Other content (C) Copyright 2006-2024 Server StorageIO and UnlimitedIO. All Rights Reserved. StorageIO is a registered Trade Mark (TM) of Server StorageIO.

Seagate 1200 12Gbs Enterprise SAS SSD StorgeIO lab review

Seagate 1200 12Gbs Enterprise SAS SSD StorgeIO lab review

This is the first post of a two part series, read the second post here.

Earlier this year I had the opportunity to test drive some Seagate 1200 12Gbs Enterprise SAS SSD’s as a follow-up to some earlier activity trying their Enterprise TurboBoost Drives. Disclosure: Seagate has been a StorageIO client and was also the sponsor of this white paper and associated proof-points mentioned in this post.

The question to ask yourself is not if flash Solid State Device (SSD) technologies are in your future, Instead the questions are when, where, using what, how to configure and related themes. SSD including traditional DRAM and NAND flash-based technologies are like real estate where location matters; however, there are different types of properties to meet various needs. This means leveraging different types of NAND flash SSD technologies in different locations in a complementary and cooperative aka hybrid way. For example nand flash SSD as part of an enterprise tiered storage strategy can be implemented server-side using PCIe cards, SAS and SATA drives as targets or as cache along with software, as well as leveraging SSD devices in storage systems or appliances.

Seagate 1200 SSD
Seagate 1200 Enterprise SAS 12Gbs SSD Image via Seagate.com

Another place where nand flash can be found and compliments SSD devices are so-called Solid State Hybrid Drives (SSHD) or Hybrid Hard Disk Drives (HHDD) including a new generation that accelerate writes as well as reads such as those Seagate refers to as with Enterprise TurboBoost. The Enterprise TurboBoost drives (view the companion StorageIO Lab review TurboBoost white paper here) were previously known as the Solid State Hybrid Drives (SSHD) or Hybrid Hard Disk Drives (HHDD). Read more about TurboBoost here and here.

The best server and storage I/O is the one you do not have to do

Keep in mind that the best server or storage I/O is that one that you do not have to do, with the second best being the one with the least overhead resolved as close to the processor (compute) as possible or practical. The following figure shows that the best place to resolve server and storage I/O is as close to the compute processor as possible however only a finite amount of storage memory located there. This is where the server memory and storage I/O hierarchy comes into play which is also often thought of in the context of tiered storage balancing performance and availability with cost and architectural limits.

Also shown is locality of reference which refers to how close data is to where it is being used and includes cache effectiveness or buffering. Hence a small amount of cache of flash and DRAM in the right location can have a large benefit. Now if you can afford it, install as much DRAM along with flash storage as possible, however if you are like most organizations with finite budgets yet server and storage I/O challenges, then deploy a tiered flash storage strategy.

flash cache locality of reference
Server memory storage I/O hierarchy, locality of reference

Seagate 1200 12Gbs Enterprise SAS SSD’s

Back to the Seagate 1200 12Gbs Enterprise SAS SSD which is covered in this StorageIO Industry Trends Perspective thought leadership white paper. The focus of the white paper is to look at how the Seagate 1200 Enterprise class SSD’s and 12Gbps SAS address current and next generation tiered storage for virtual, cloud, traditional Little and Big Data infrastructure environments.

Seagate 1200 Enteprise SSD

This includes providing proof points running various workloads including Database TPC-B, TPC-E and Microsoft Exchange in the StorageIO Labs along with cache software comparing SSD, SSHD and different HDD’s including 12Gbs SAS 6TB near-line high-capacity drives.

Seagate 1200 Enterprise SSD Proof Points

The proof points in this white paper are from an applications focus perspective representing more of an end-to-end real-world situation. While they are not included in this white paper, StorageIO has run traditional storage building-block focus workloads, which can be found at StorageIOblog (Part II: How many IOPS can a HDD, HHDD or SSD do with VMware?). These include tools such as Iometer, iorate, vdbench among others for various IO sizes, mixed, random, sequential, reads, writes along with “hot-band" across different number of threads (concurrent users). “Hot-Band” is part of the SNIA Emerald energy effectiveness metrics for looking at sustained storage performance using tools such as vdbench. Read more about other various server and storage I/O benchmarking tools and techniques here.

For the following series of proof-points (TPC-B, TPC-E and Exchange) a system under test (SUT) consisted of a physical server (described with the proof-points) configured with VMware ESXi along with guests virtual machines (VMs) configured to do the storage I/O workload. Other servers were used in the case of TPC workloads as application transactional requester to drive the SQL Server database and resulting server storage I/O workload. VMware was used in the proof-points to reflect a common industry trend of using virtual server infrastructures (VSI) supporting applications including database, email among others. For the proof-point scenarios, the SUT along with storage system device under test were dedicated to that scenario (e.g. no other workload running) unless otherwise noted.

Server Storage I/O config
Server Storage I/O configuration for proof-points

Microsoft Exchange Email proof-point configuration

For this proof-point, Microsoft Jet Stress Exchange performance workloads were placed (e.g. Exchange Database – EDB file) on each of the different devices under test with various metrics shown including activity rates and response time for reads as well as writes. For the Exchange testing, the EDB was placed on the device being tested while its log files were placed on a separate Seagate 400GB Enterprise 12Gbps SAS SSD.

Test configuration: Seagate 400GB 12000 2.5” SSD (ST400FM0073) 12Gbps SAS, 600GB 2.5” Enterprise 15K with TurboBoost™ (ST600MX) 6 Gbps SAS, 600GB 2.5” Enterprise Enhanced 15K V4 (15K RPM) HDD (ST600MP) with 6 Gbps SAS, Seagate Enterprise Capacity Nearline (ST6000NM0014) 6TB 3.5” 7.2K RPM HDD 12 Gbps SAS and 3TB 7.2K SATA HDD. Email server hosted as guest on VMware vSphere/ESXi V5.5, Microsoft SBS2011 Service Pack 1 64 bit. Guest VM (VMware vSphere 5.5) was on a SSD based dat, had a physical machine (host), with 14 GB DRAM, quad CPU (4 x 3.192GHz) Intel E3-1225 v300, with LSI 9300 series 12Gbps SAS adapters in a PCIe Gen 3 slot with Jet Stress 2010.  All devices being tested were Raw Device Mapped (RDM) where EDB resided. VM on a SSD based separate data store than devices being tested. Log file IOPs were handled via a separate SSD device also persistent (no delayed writes). EDB was 300GB and workload ran for 8 hours.

Microsoft Exchange VMware SSD performance
Microsoft Exchange proof-points comparing various storage devices

TPC-B (Database, Data Warehouse, Batch updates) proof-point configuration

SSD’s are a good fit for both transaction database activity with reads and write as well as query-based decision support systems (DSS), data warehouse and big data analytics. The following are proof points of SSD capabilities for database activity. In addition to supporting database table files and objects, along with transaction journal logs, other uses include for meta-data, import/export or other high-IO and write intensive scenarios. Two database workload profiles were tested including batch update (write-intensive) and transactional. Activity involved running Transaction Performance Council (TPC) workloads TPC-B (batch update) and TPC-E (transaction/OLTP simulate financial trading system) against Microsoft SQL Server 2012 databases. Each test simulation had the SQL Server database (MDF) on a different device with transaction log file (LDF) on a separate SSD. TPC-B for a single device results shown below.

TPC-B (write intensive) results below show how TPS work being done (blue) increases from left to right (more is better) for various numbers of simulated users. Also shown on the same line for each amount of TPS work being done is the average latency in seconds (right to left) where lower is better. Results are shown from top to bottom for each group of users (100, 50, 20 and 1) for the different drives being tested (top to bottom). Note how the SSD device does more work at a lower response time vs. traditional HDD’s

Test configuration: Seagate 400GB 12000 2.5” SSD (ST400FM0073) 12Gbps SAS, 600GB 2.5” Enterprise 15K with TurboBoost™ (ST600MX) 6 Gbps SAS, 600GB 2.5” Enterprise Enhanced 15K V4 (15K RPM) HDD (ST600MP) with 6 Gbps SAS, Seagate Enterprise Capacity Nearline (ST6000NM0014) 6TB 3.5” 7.2K RPM HDD 12 Gbps SAS and 3TB Seagate 7.2K SATA HDD Workload generator and virtual clients Windows 7 Ultimate 64 bit. Microsoft SQL Server 2012 database was on Windows 7 guest. Guest VM (VMware vSphere 5.5) had a dedicated 14 GB DRAM, quad CPU (4 x 3.192GHz) Intel E3-1225 v300, with LSI 9300 series 12Gbps SAS adapters in a PCIe Gen 3 slot along with TPC-B (www.tpc.org) workloads.

VM with guest OS along with SQL tempdb and masterdb resided on separate SSD based data store from devices being tested (e.g., where MDF (main database tables) and LDF (log file) resided). All devices being tested were Raw Device Mapped (RDM) independent persistent with database log file on a separate SSD device also persistent (no delayed writes) using VMware PVSCSI driver. MDF and LDF file sizes were 142GB and 26GB with scale factor of 10000, with each step running for one hour (10-minute preamble). Note that these proof-points DO NOT use VMware or any other third-party cache software or I/O acceleration tool technologies as those are covered later in a separate proof-point.

TPC-B sql server database SSD performance
TPC-B SQL Server database proof-points comparing various storage devices

TPC-E (Database, Financial Trading) proof-point configuration

The following shows results from TPC-E test (OLTP/transactional workload) simulating a financial trading system. TPC-E is an industry standard workload that performs a mix of reads and writes database queries. Proof-points were performed with various numbers of users from 10, 20, 50 and 100 to determine (TPS) Transaction per Second (aka I/O rate) and response time in seconds. The TPC-E transactional results are shown for each device being tested across different user workloads. The results show how TPC-E TPS work (blue) increases from left to right (more is better) for larger numbers of users along with corresponding latency (green) that goes from right to left (less is better). The Seagate Enterprise 1200 SSD is shown on the top in the figure below with a red box around its results. Note how the SSD as a lower latency while doing more work compared to the other traditional HDD’s

Test configuration: Seagate 400GB 12000 2.5” SSD (ST400FM0073) 12Gbps SAS, 600GB 2.5” Enterprise 15K with TurboBoost™ (ST600MX) 6 Gbps SAS, 600GB 2.5” Enterprise Enhanced 15K V4 (15K RPM) HDD (ST600MP) with 6 Gbps SAS, Seagate Enterprise Capacity Nearline (ST6000NM0014) 6TB 3.5” 7.2K RPM HDD 12 Gbps SAS and 3TB Seagate 7.2K SATA HDD Workload generator and virtual clients Windows 7 Ultimate 64 bit. Microsoft SQL Server 2012 database was on Windows 7 guest. Guest VM (VMware vSphere 5.5) had a dedicated 14 GB DRAM, quad CPU (4 x 3.192GHz) Intel E3-1225 v300, with LSI 9300 series 12Gbps SAS adapters in a PCIe Gen 3 slot along with TPC-B (www.tpc.org) workloads.

VM with guest OS along with SQL tempdb and masterdb resided on separate SSD based data store from devices being tested (e.g., where MDF (main database tables) and LDF (log file) resided). All devices being tested were Raw Device Mapped (RDM) independent persistent with database log file on a separate SSD device also persistent (no delayed writes) using VMware PVSCSI driver. MDF and LDF file sizes were 142GB and 26GB with scale factor of 10000, with each step running for one hour (10-minute preamble). Note that these proof-points DO NOT use VMware or any other third-party cache software or I/O acceleration tool technologies as those are covered later in a separate proof-point.

TPC-E sql server database SSD performance
TPC-E (Financial trading) SQL Server database proof-points comparing various storage devices

Continue reading part-two of this two-part series here including the virtual server storage I/O blender effect and solution.

Ok, nuff said (for now).

Cheers gs

Greg Schulz – Author Cloud and Virtual Data Storage Networking (CRC Press), The Green and Virtual Data Center (CRC Press) and Resilient Storage Networks (Elsevier)
twitter @storageio

All Comments, (C) and (TM) belong to their owners/posters, Other content (C) Copyright 2006-2024 Server StorageIO and UnlimitedIO LLC All Rights Reserved

Server Storage I/O Network Benchmark Winter Olympic Games

Storage I/O trends

Server Storage I/O Network Benchmark Winter Olympic Games

It is time for the 2014 Winter Olympic games in Sochi Russia where competitors including some athletes come together in what has become a mix of sporting and entertainment engaging activities.

Games of inches and seconds, performance and skill

Some of these activities including real Olympic game events are heavier on sports appeal, some with artistic and others pure entertainment with a mix of beauty, braun and maybe even a beast or two. Then there are those events that have been around since the last ice age, while others being post global warming era.

Hence some have been around longer than others showing a mix of old, new in terms of the sports, athletes not to mention technology and their outfits.

I mean how about some of the new snow boarding and things on skis being done, can you image if they brought in as a new "X" sport roller derby on the short speed skating track sponsored by Red Bull or Bud light? Wait, that sounds like the Red Bull Crashed Ice event (check this out if not familiar with) think motto cross, hockey, down hill on ice. How about getting some of the south African long distance sprinters to learn how to speed skate, talk about moving some gold metal as in medals back to the african continent! On the other hand, the current powers to be would lodge protest, change the benchmark or rules to stay in power, hmm, sound familiar with IT?

Ok, enough of the fun stuff (for now), let’s get back on track here (catch that pun?).

Metrics that matter, winners and losers

Since these are the Olympics, lets also remember that there still awards for personal and team winners (along with second and third place), after all, if all Olympians were winners, there would be no losers and if no losers, how could there be a winner?

Who or what decides the winners vs. losers involves metrics that matter, something that also applies to servers, storage I/O networking hardware, software and services.

In the case of the Olympics, some of the sports or events are based on speed or how fast (e.g. time) something is done, or how much is accumulated or done in that amount of time while in other events the metrics that matter may be more of a mystery based on judging that maybe subjective.

The technologies to record times, scores, movements and other things that go into scoring have certainly improved, as have the ability for fans to engage and vote their choice, or opposition via social media venues from twitter to face book among others.

What about server storage I/O networking benchmarks

There could easily be an Information Technology (IT) or data infrastructure benchmarking Olympics with events such as faster server (physical, virtual or cloud, personal or consortium team), storage, I/O and networking across hardware, software or services. Of course there would be different approaches favored by the various teams with disputes, protests and other things sometimes seen during Olympic games. One of the challenges however is what would be the metrics that matter particularly to the various marketing groups of each organization or their joint consortium?

Just like with sports, which of the various industry trade groups or consortiums would be the ruling party or voice for a particular event specifying the competition criteria, scoring and other things. What happens when there is a break away group that launches their own competing approach yet when it comes time for the IT benchmarking Olympics, which of the various bodies does the Olympic committee defer to? In case you are not familiar with in sports there are various groups and sub-groups who can decide the participants for various supports perhaps independent of an overall group, sound like IT?

Storage I/O trends

Let the games begin

So then the fun starts, however which of the events are relevant to your needs or interest, sure some are fun or entertaining while others are not practical. Some you can do yourself, while others are just fun to watch, both the thrill of victory and agony of defeat.

This is similar to IT industry benchmarking and specmanship competitions, some of which is more relevant than others, then there are those that are entertaining.

Likewise some benchmarks or workload claims can be reproduced to confirm the results or claims, while others remain more like the results of figure skating judges.

Hence some of the benchmark games are more entertaining, however for those who are not aware or informed, they may turn out to be more misinformation or lead to poor decision-making.

Consequently benchmarks and metrics that matter are those that most closely aging with what your environment is or will be doing.

If your environment is going to be running a particularly simulation or script, than so be it, otoh, look for comparisons that are reflective.

On the other hand, if you can’t find something that is applicable, then look at tools and results that have meaning along with relevance, not to mention that provide clarity and repeatable. Being repeatable means that you can get access to the tools, scripts or scenario (preferably free) to run in your own environment.

There is a long list of benchmarks and workload simulation tools, as well as traces available, some for free, some for fee that apply to components, subsystems or complete application systems from server, storage I/O networking applications and hardware. These include those for Email such as Microsoft Exchange related, SQL databases, , LoginVSI for VDI, VMmark for VMware, Hadoop and HDFS related for big data among many others (see more here).

Apples to Apples vs. Apple pie vs. Orange Jello

Something else that matters are apples to apples vs. apples to oranges or worse, apple pie to orange Jello.

This means knowing or gaining insight into the pieces as we as how they behave under different conditions as well as the entire system for a baseline (e.g normal) vs. abnormal.

Hence its winter server storage I/O networking benchmark games with the first event having been earlier this week with team Brocade taking on Cisco. Here is a link to a post by Tony Bourke (@tbourke) that provides some interesting perspectives and interactions, along with a link here to the Brocade sponsored report done by Evaluator Group.

In this match-up, Team Brocade (with HP servers, Brocade switches and an unnamed 16GFC SSD storage system) take on Team Cisco and their UCS (also an un-named 16GFC SSD system that I wonder if Cisco even knows whose’s it was?). Ironic that it was almost six years to the date that there was a similar winter benchmark wonder event when NetApp submitted an SPC result for EMC (read more about that cold day here).

The Brocade FC (using HP servers and somebody’s SSD storage) vs. Cisco FCoE using UCS (and somebody else’s storage) comparison is actually quite entertaining, granted it can also be educational on what to do or not do, focus on or include among others things. The report also raises many questions that seem more wondering why somebody won in an ice figuring skating event vs. the winner of a men’s or women’s hockey game.

Closing thoughts (for now)

So here’s my last point and perspective, let’s have a side of context with them IOPs, TPS, bandwidth and other metrics that matter.

Take metrics and benchmarks with a grain of salt however look for transparency in both how they are produced, information provided and most important, does it matter or is it relevant to your environment or simply entertaining.

Lets see what the next event in the ongoing server storage I/O networking benchmark 2014 winter Olympic games will be.

Some more reading:
SPC and Storage Benchmarking Games
Moving Beyond the Benchmark Brouhaha
More storage and IO metrics that matter
Its US Census time, What about IT Data Centers?
March Metrics and Measuring Social Media (keep in mind that March Madness is just around the corner)
PUE, Are you Managing Power, Energy or Productivity?

How many IOPS can a HDD, HHDD or SSD do?
Part II: How many IOPS can a HDD, HHDD or SSD do with VMware?

You can also take part in the on-going or re-emerging FC vs. FCoE hype and fud events by casting your vote here and see results below.

Note the following poll is from a previous StorageIOblog post (Where has the FCoE hype and FUD gone? (with poll)).

Disclosure: I used to work for Evaluator Group after working for a company called Inrange that competed with, then got absorbed (via CNT and McData) into Brocade who has been a client as has Cisco. I also do performance and functionality testing, audits, validation and proof of concepts services in my own as well as in client labs using various industry standard available tools and techniques. Otoh, not sure that I even need to disclose anything however its easy enough to do so why not ;).

Ok, nuff said (for now)

Cheers gs

Greg Schulz – Author Cloud and Virtual Data Storage Networking (CRC Press), The Green and Virtual Data Center (CRC Press) and Resilient Storage Networks (Elsevier)
twitter @storageio

All Comments, (C) and (TM) belong to their owners/posters, Other content (C) Copyright 2006-2024 Server StorageIO and UnlimitedIO LLC All Rights Reserved

Can we get a side of context with them IOPS server storage metrics?

Can we get a side of context with them server storage metrics?

Storage I/O trends

Updated 2/10/2018

Whats the best server storage I/O network metric or benchmark? It depends as there needs to be some context with them IOPS and other server storage I/O metrics that matter.

There is an old saying that the best I/O (Input/Output) is the one that you do not have to do.

In the meantime, let’s get a side of some context with them IOPS from vendors, marketers and their pundits who are tossing them around for server, storage and IO metrics that matter.

Expanding the conversation, the need for more context

The good news is that people are beginning to discuss storage beyond space capacity and cost per GByte, TByte or PByte for both DRAM or nand flash Solid State Devices (SSD), Hard Disk Drives (HDD) along with Hybrid HDD (HHDD) and Solid State Hybrid Drive (SSHD) based solutions. This applies to traditional enterprise or SMB IT data center with physical, virtual or cloud based infrastructures.

hdd and ssd iops

This is good because it expands the conversation beyond just cost for space capacity into other aspects including performance (IOPS, latency, bandwidth) for various workload scenarios along with availability, energy effective and management.

Adding a side of context

The catch is that IOPS while part of the equation are just one aspect of performance and by themselves without context, may have little meaning if not misleading in some situations.

Granted it can be entertaining, fun to talk about or simply make good press copy for a million IOPS. IOPS vary in size depending on the type of work being done, not to mention reads or writes, random and sequential which also have a bearing on data throughout or bandwidth (Mbytes per second) along with response time.

However, are those million IOP’s applicable to your environment or needs?

Likewise, what do those million or more IOPS represent about type of work being done? For example, are they small 64 byte or large 64 Kbyte sized, random or sequential, cached reads or lazy writes (deferred or buffered) on a SSD or HDD?

How about the response time or latency for achieving them IOPS?

In other words, what is the context of those metrics and why do they matter?

storage i/o iops
Click on image to view more metrics that matter including IOP’s for HDD and SSD’s

Metrics that matter give context for example IO sizes closer to what your real needs are, reads and writes, mixed workloads, random or sequential, sustained or bursty, in other words, real world reflective.

As with any benchmark take them with a grain (or more) of salt, they key is use them as an indicator then align to your needs. The tool or technology should work for you, not the other way around.

Here are some examples of context that can be added to help make IOP’s and other metrics matter:

  • What is the IOP size, are they 512 byte (or smaller) vs. 4K bytes (or larger)?
  • Are they reads, writes, random, sequential or mixed and what percentage?
  • How was the storage configured including RAID, replication, erasure or dispersal codes?
  • Then there is the latency or response time and IO queue depths for the given number of IOPS.
  • Let us not forget if the storage systems (and servers) were busy with other work or not.
  • If there is a cost per IOP, is that list price or discount (hint, if discount start negotiations from there)
  • What was the number of threads or workers, along with how many servers?
  • What tool was used, its configuration, as well as raw or cooked (aka file system) IO?
  • Was the IOP’s number with one worker or multiple workers on a single or multiple servers?
  • Did the IOP’s number come from a single storage system or total of multiple systems?
  • Fast storage needs fast serves and networks, what was their configuration?
  • Was the performance a short burst, or long sustained period?
  • What was the size of the test data used; did it all fit into cache?
  • Were short stroking for IOPS or long stroking for bandwidth techniques used?
  • Data footprint reduction (DFR) techniques (thin provisioned, compression or dedupe) used?
  • Were write data committed synchronously to storage, or deferred (aka lazy writes used)?

The above are just a sampling and not all may be relevant to your particular needs, however they help to put IOP’s into more contexts. Another consideration around IOPS are the configuration of the environment, from an actual running application using some measurement tool, or are they generated from a workload tool such as IOmeter, IOrate, VDbench among others.

Sure, there are more contexts and information that would be interesting as well, however learning to walk before running will help prevent falling down.

Storage I/O trends

Does size or age of vendors make a difference when it comes to context?

Some vendors are doing a good job of going for out of this world record-setting marketing hero numbers.

Meanwhile other vendors are doing a good job of adding context to their IOP or response time or bandwidth among other metrics that matter. There is a mix of startup and established that give context with their IOP’s or other metrics, likewise size or age does not seem to matter for those who lack context.

Some vendors may not offer metrics or information publicly, so fine, go under NDA to learn more and see if the results are applicable to your environments.

Likewise, if they do not want to provide the context, then ask some tough yet fair questions to decide if their solution is applicable for your needs.

Storage I/O trends

Where To Learn More

View additional NAS, NVMe, SSD, NVM, SCM, Data Infrastructure and HDD related topics via the following links.

Additional learning experiences along with common questions (and answers), as well as tips can be found in Software Defined Data Infrastructure Essentials book.

Software Defined Data Infrastructure Essentials Book SDDC

What This All Means

What this means is let us start putting and asking for metrics that matter such as IOP’s with context.

If you have a great IOP metric, if you want it to matter than include some context such as what size (e.g. 4K, 8K, 16K, 32K, etc.), percentage of reads vs. writes, latency or response time, random or sequential.

IMHO the most interesting or applicable metrics that matter are those relevant to your environment and application. For example if your main application that needs SSD does about 75% reads (random) and 25% writes (sequential) with an average size of 32K, while fun to hear about, how relevant is a million 64 byte read IOPS? Likewise when looking at IOPS, pay attention to the latency, particular if SSD or performance is your main concern.

Get in the habit of asking or telling vendors or their surrogates to provide some context with them metrics if you want them to matter.

So how about some context around them IOP’s (or latency and bandwidth or availability for that matter)?

Ok, nuff said, for now.

Gs

Greg Schulz – Microsoft MVP Cloud and Data Center Management, VMware vExpert 2010-2017 (vSAN and vCloud). Author of Software Defined Data Infrastructure Essentials (CRC Press), as well as Cloud and Virtual Data Storage Networking (CRC Press), The Green and Virtual Data Center (CRC Press), Resilient Storage Networks (Elsevier) and twitter @storageio. Courteous comments are welcome for consideration. First published on https://storageioblog.com any reproduction in whole, in part, with changes to content, without source attribution under title or without permission is forbidden.

All Comments, (C) and (TM) belong to their owners/posters, Other content (C) Copyright 2006-2024 Server StorageIO and UnlimitedIO. All Rights Reserved. StorageIO is a registered Trade Mark (TM) of Server StorageIO.

IBM vs. Oracle, NAD intervenes, again

StorageIO industry trends cloud, virtualization and big data

With HP announcing that they were sold a bogus deal with Autonomy (read here, here and here among others) and the multi billion write off (loss), or speculation of who will be named the new CEO of Intel in 2013, don’t worry if you missed the latest in the ongoing IBM vs. Oracle campaign. The other day the NAD (National Advertising Directive) part of the Better Business Bureau (BBB) issued yet another statement about IBM and Oracle (read here and posted below).

NAD BBB logo

In case you had not heard, earlier this year, Oracle launched an advertising promotion touting how much faster their solutions are vs. IBM. Perhaps you even saw the advertising billboards along highways or in airports making the Oracle claims.

Big Blue (e.g. IBM) being the giant that they are was not going take the Oracle challenge sitting down and stepped up and complained to the better business bureau (BBB). As a result, the NAD issued a decision for Oracle to stop the ads (read more here). Oracle at 37.1B (May 2012 annual earnings) is about a third the size of IBM at 106.9B (2011 earnings), thus neither is exactly a small business.

Lets get back to the topic at hand the NAD issued yet another directive. In the latest spat, after the first Ads, Oracle launched the 10M challenge (you can read about that here).

Oracle 10 million dollar challenge ad image

Once again the BBB and the NAD weighs in for IBM and issued the following statement (mentioned above):

For Immediate Release
Contact: Linda Bean
212.705.0129

NAD Determines Oracle Acted Properly in Discontinuing Performance Claim Couched in ‘Contest’ Language

New York, NY – Nov. 20, 2012 – The National Advertising Division has determined that Oracle Corporation took necessary action in discontinuing advertising that stated its Exadata server is “5x Faster Than IBM … Or you win $10,000,000.”

The claim, which appeared in print advertising in the Wall Street Journal and other major newspapers, was challenged before NAD by International Business Machines Corporation.

NAD is an investigative unit of the advertising industry system of self-regulation and is administered by the Council of Better Business Bureaus.

As an initial matter, NAD considered whether or not Oracle’s advertisement conveyed a comparative performance claim – or whether the advertisement simply described a contest.

In an NAD proceeding, the advertiser is obligated to support all reasonable interpretations of its advertising claims, not just the message it intended to convey. In the absence of reliable consumer perception evidence, NAD uses its judgment to determine what implied messages, if any, are conveyed by an advertisement.

Here, NAD found that, even accounting for a sophisticated target audience, a consumer would be reasonable to take away the message that all Oracle Exadata systems run five times as fast as all IBM’s Power computer products. NAD noted in its decision that the fact that the claim was made in the context of a contest announcement did not excuse the advertiser from its obligation to provide substantiation.

The advertiser did not provide any speed performance tests, examples of comparative system speed superiority or any other data to substantiate the message that its Exadata computer systems run data warehouses five times as fast as IBM Power computer systems.

Accordingly, NAD determined that the advertiser’s decision to permanently discontinue this advertisement was necessary and appropriate. Further, to the extent that Oracle reserves the right to publish similar advertisements in the future, NAD cautioned that such performance claims require evidentiary support whether or not the claims are couched in a contest announcement.

Oracle, in its advertiser’s statement, said it disagreed with NAD’s findings, but would take “NAD’s concerns into account should it disseminate similar advertising in the future.”

###

NAD’s inquiry was conducted under NAD/CARU/NARB Procedures for the Voluntary Self-Regulation of National Advertising. Details of the initial inquiry, NAD’s decision, and the advertiser’s response will be included in the next NAD/CARU Case Report.

About Advertising Industry Self-Regulation: The Advertising Self-Regulatory Council establishes the policies and procedures for advertising industry self-regulation, including the National Advertising Division (NAD), Children’s Advertising Review Unit (CARU), National Advertising Review Board (NARB), Electronic Retailing Self-Regulation Program (ERSP) and Online Interest-Based Advertising Accountability Program (Accountability Program.) The self-regulatory system is administered by the Council of Better Business Bureaus.

Self-regulation is good for consumers. The self-regulatory system monitors the marketplace, holds advertisers responsible for their claims and practices and tracks emerging issues and trends. Self-regulation is good for advertisers. Rigorous review serves to encourage consumer trust; the self-regulatory system offers an expert, cost-efficient, meaningful alternative to litigation and provides a framework for the development of a self-regulatory to emerging issues.

To learn more about supporting advertising industry self-regulation, please visit us at: www.asrcreviews.org.

Linda Bean Director, Communications,
Advertising Self-Regulatory Council

Tel: 212.705.0129
Cell: 908.812.8175
lbean@asrc.bbb.org

112 Madison Ave.
3rd Fl.
New York, NY
10016

Not surprisingly, IBM sent the following email to highlight their latest news:

Greg,

For the third time in eight months Oracle has agreed to kill a misleading advertisement targeting IBM after scrutiny from the Better Business Bureau’s National Advertising Division.

Oracle’s ‘$10 Million Challenge’ ad claimed that its Exadata server was ‘Five Times Faster than IBM Power or You Win $10,000,000.’ The advertising council just issued a press release announcing that the claim was not supported by the evidence in the record, and that Oracle has agreed to stop making the claim. ‘[Oracle] did not provide speed performance tests, examples of comparative systems speed superiority or any other data to  substantiate its message,’ the BBB says in the release: The ads ran in The Wall Street Journal, The Economist, Chief Executive Magazine, trade publications and online.

The National Advertising Division reached similar judgments against Oracle advertising on two previous occasions this year. Lofty and unsubstantiated claims about Oracle systems being ‘Twenty Times Faster than IBM’ and ‘Twice as Fast Running Java’ were both deemed to be unsubstantiated and misleading. Oracle quietly shelved both campaigns.

If you follow Oracle’s history of claims, you won’t be surprised that the company issues misleading ads until they’re called out in public and forced to kill the campaign. As far back as 2001, Oracle’s favorite tactic has been to launch unsubstantiated attacks on competitors in ads while promising prize money to anyone who can disprove the bluff. Not surprisingly, no prize money is ever paid as the campaigns wither under scrutiny. They are designed to generate publicity for Oracle, nothing more. You may be familiar with their presentation, ‘Ridding the Market of Competition,’ which they issued to the Society of Competitive Intelligence Professionals laying out their strategy.

The repeated rulings by the BBB even caused analyst Rob Enderle to comment that, ‘there have been significant forced retractions and it is also apparent that increasingly the only people who could cite these false Oracle performance advantages with a straight face were Oracle’s own executives, who either were too dumb to know they were false or too dishonest to care.’

Let me know if you’re interested in following up on this news. You won’t hear anything about it from Oracle.

Best,

Chris

Christopher Rubsamen
Worldwide Communications for PureSystems and Cloud Computing
IBM Systems & Technology Group
aim: crubsamen
twitter: @crubsamen

Wow, I never knew however I should not be surprised that there is a Society of Competitive Intelligence Professionals.

Now Oracle is what they are, aggressive and have a history of doing creative or innovative (e.g. stepping out-of-bounds) in sales and marketing campaigns, benchmarking and other activities. On the other hand has IBM been victimized at the hands of Oracle and thus having to resort to using the BBB and NAD as part of its new sales and marketing tool to counter Oracle?

Does anybody think that the above will cause Oracle to retreat, repent, and tone down how they compete on the field of sales and marketing of servers, storage, database and related IT, ICT, big and little data, clouds?

Anyone else have a visual of a group of IBMers sitting around a table at an exclusive country club enjoying a fine cigar along with glass of cognac toasting each other on their recent success in having the BBB and NAD issue another ruling against Oracle. Meanwhile perhaps at some left coast yacht club, the Oracle crew are high fiving, congratulating each other on their commission checks while spraying champagne all over the place like they just won the Americas cup race?

How about it Oracle, IBM says Im not going to hear anything from you, is that true?

Ok, nuff said (for now).

Cheers gs

Greg Schulz – Author Cloud and Virtual Data Storage Networking (CRC Press, 2011), The Green and Virtual Data Center (CRC Press, 2009), and Resilient Storage Networks (Elsevier, 2004)

twitter @storageio

All Comments, (C) and (TM) belong to their owners/posters, Other content (C) Copyright 2006-2012 StorageIO and UnlimitedIO All Rights Reserved

NAD recommends Oracle discontinue certain Exadata performance claims

I Received the following press release in my inbox today from the National Advertising Division (NAD) recommending that Oracle stop making certain performance claims about Exadata after a complaint from IBM.

Oracle Exadata

In case you are not familiar with ExaData, it is a database machine or storage appliance that only supports Oracle database systems (learn more here). Oracle having bought Sun microsystems a few years back moved from being a software vendor that competed with other vendors software solutions including those from IBM while running on hardware from Dell, HP and IBM among others. Now that Oracle is in the hardware business, while you will still find Oracle software products running on their competitors hardware (servers and storage), Oracle is also more aggressively competing with those same partners, particularly IBM.

Hmm, to quote Scooby Doo: Rut Roh!

Looks like IBM complained to the Better Business Bureau (BBB) National Advertising Division (NAD) that resulted in the Advertising Self-Regulatory Council (ASRC) making their recommendation below (more about NAD and ASRC can be found here). Based on a billboard sign that I saw while riding from JFK airport into New York City last week, I would not be surprised if a company with two initials that start with an H and end with a P were to file a similar complaint.

I Wonder if the large wall size Oracle advertisement that used to be in the entry way to the white plains (IATA:HPN) airport (e.g. in IBM’s backyard) welcoming you to the terminal as you get off the airplanes is still there?

The following is the press release that I received:

For Immediate Release
Contact: Linda Bean
212.705.0129

NAD Finds Oracle Took Necessary Action in Discontinuing Comparative Performance Claims for Exadata; Oracle to Appeal NAD Decision

New York, NY – July 24,  2012 –TheNational Advertising Division has recommended that Oracle Corporation discontinue certain comparative product-performance claims for the company’s Exadata database machines, following a challenge by International Business Machines Corporation. Oracle said it would voluntarily discontinue the challenged claims, but noted that it would appeal NADs decision to the National Advertising Review Board.

The advertising claims at issue appeared in a full-page advertisement in the Wall Street Journal and included the following:

  • “Exadata 20x Faster … Replaces IBM Again”
  • “Giant European Retailer Moves Databases from IBM Power to Exadata … Runs 20 Times Faster”

NAD also considered whether the advertising implied that all Oracle Exadata systems are twenty times faster than all IBM Power systems.

The advertisement featured the image of an Oracle Exadata system, along with the statement: “Giant European Retailer Moves Databases from IBM Power to Exadata Runs 20 Times Faster.” The advertisement also offered a link to the Oracle website: “For more details oracle.com/EuroRetailer.” 

IBM argued that the “20x Faster” claim makes overly broad references to “Exadata” and “IBM Power,” resulting in a misleading claim, which the advertiser’s evidence does not support.  In particular, the challenger argued that by referring to the brand name “IBM Power” without qualification, Oracle was making a broad claim about the entire IBM Power systems line of products. 

The advertiser, on the other hand, argued that the advertisement represented a case study, not a line claim, and noted that the sophisticated target audience would understand that the advertisement is based on the experience of one customer – the “Giant European Retailer” referenced in the advertisement.

In a NAD proceeding, the advertiser is obligated to support all reasonable interpretations of its advertising claims, not just the message it intended to convey.   In the absence of reliable consumer perception evidence, NAD uses its experienced judgment to determine what implied messages, if any, are conveyed by an advertisement.   When evaluating the message communicated by an advertising claim, NAD will examine the claims at issue in the context of the entire advertisement in which they appear.

In this case, NAD concluded that while the advertiser may have intended to convey the message that in one case study a particular Exadata system was up to 20 times faster when performing two particular functions than a particular IBM Power system, Oracle’s general references to “Exadata” and “IBM Power,” along with the bold unqualified headline “Exadata 20x Faster Replaces IBM Again,” conveyed a much broader message.

NAD determined that at least one reasonable interpretation of the challenged advertisement is that all – or a vast majority – of Exadata systems consistently perform 20 times faster in all or many respects than all – or a vast majority – of IBM Power systems. NAD found that the message was not supported by the evidence in the record, which consisted of one   particular comparison of one consumer’s specific IBM Power system to a specific Exadata System. 

NAD further determined that the disclosure provided on the advertiser’s website was not sufficient to limit the broad message conveyed by the “20x Faster” claim. More importantly, NAD noted that even if Oracle’s website disclosure was acceptable – and had appeared clearly and conspicuously in the challenged advertisement – it would still be insufficient because an advertiser cannot use a disclosure to cure an otherwise false claim.

NAD noted that Oracle’s decision to permanently discontinue the claims at issue was necessary and proper.

Oracle, in its advertiser’s statement, said it was “disappointed with the NAD’s decision in this matter, which it believes is unduly broad and will severely limit the ability to run truthful comparative advertising, not only for Oracle but for others in the commercial hardware and software industry.”

Oracle noted that it would appeal all of NAD’s findings in the matter.


###

NAD’s inquiry was conducted under NAD/CARU/NARB Procedures for the Voluntary Self-Regulation of National Advertising.  Details of the initial inquiry, NAD’s decision, and the advertiser’s response will be included in the next NAD/CARU Case Report.

About Advertising Industry Self-Regulation:  The Advertising Self-Regulatory Council establishes the policies and procedures for advertising industry self-regulation, including the National Advertising Division (NAD), Children’s Advertising Review Unit (CARU), National Advertising Review Board (NARB), Electronic Retailing Self-Regulation Program (ERSP) and Online Interest-Based Advertising Accountability Program (Accountability Program.) The self-regulatory system is administered by the Council of Better Business Bureaus.

Self-regulation is good for consumers. The self-regulatory system monitors the marketplace, holds advertisers responsible for their claims and practices and tracks emerging issues and trends. Self-regulation is good for advertisers. Rigorous review serves to encourage consumer trust; the self-regulatory system offers an expert, cost-efficient, meaningful alternative to litigation and provides a framework for the development of a self-regulatory to emerging issues.

To learn more about supporting advertising industry self-regulation, please visit us at: www.asrcreviews.org.


Linda Bean l Director, Communications,
Advertising Self-Regulatory Council

Tel: 212.705.0129
Cell: 908.812.8175
lbean@asrc.bbb.org

112 Madison Ave.
3rd Fl.
New York, NY
10016


Ok, Oracle is no stranger to benchmark and performance claims controversy having amassed several decades of experience. Anybody remember the silver bullet database test from late 80s early 90s when Oracle set a record performance except that they never committed the writes to disk?

Something tells me that Oracle and Uncle Larry (e.g. Larry Ellison who is not really my uncle) will treat this as any kind of press or media coverage is good and probably will issue something like IBM must be worried if they have to go to the BBB.

Will a complaint which I’m sure is not the fist to be lodged with the BBB against Oracle deter customers, or be of more use to IBM sales and their partners in deals vs. Oracle?

What’s your take?

Is this much ado about nothing, a filler for a slow news or discussion day, a break from talking about VMware acquisition of Nicira or VMware CEO management changes? Perhaps this is an alternative to talking about the CEO of SSD vendor STEC being charged with insider trading, or something other than Larry Ellison buying an Hawaiian island (IMHO he could have gotten a better deal buying Greece), or is this something that Oracle will need to take seriously?

Ok, nuff said for now

Cheers Gs

Greg Schulz – Author Cloud and Virtual Data Storage Networking (CRC Press, 2011), The Green and Virtual Data Center (CRC Press, 2009), and Resilient Storage Networks (Elsevier, 2004)

twitter @storageio

All Comments, (C) and (TM) belong to their owners/posters, Other content (C) Copyright 2006-2012 StorageIO and UnlimitedIO All Rights Reserved

Give HP storage some love and short strokin

Server and StorageIO industry trends and perspective DAS

Following up from my last post over at InfoStor about metrics that matter, here is a link to a new piece that I did on storage vendors benchmarking and related topics. This new post looked at an storage performance council (SPC1) benchmark that HP did with their P10000 (e.g. 3PAR) storage system under assertions by some in the industry that they were short stroking to meet better performance.

Amazon Web Services (AWS)

I’m surprised some creative technical marketer, blogger or prankster has yet to rework Clarence Carters (e.g. Dr. CC) iconic song into something about storage performance and capacity short strokin.


Ok, nuff said before I get a visit from the HP truth squads, in the meantime, give HP a hug and some love if so inclined.

Cheers Gs

Greg Schulz – Author Cloud and Virtual Data Storage Networking (CRC Press, 2011), The Green and Virtual Data Center (CRC Press, 2009), and Resilient Storage Networks (Elsevier, 2004)

twitter @storageio

All Comments, (C) and (TM) belong to their owners/posters, Other content (C) Copyright 2006-2012 StorageIO and UnlimitedIO All Rights Reserved

Congratulations to IBM for releasing XIV SPC results

Over the past several years I have done an annual post about IBM and their XIV storage system and this is the fourth in what has become a series. You can read the first one here, the second one here, and last years here and here after the announcement of the IBM V7000.

IBM XIV Gen3
IBM recently announced the generation 3 or Gen3 version of XIV along with releasing for the first time public performance comparison benchmarks using storage performance council (SPC) throughout SPC2 workload.

The XIV Gen3 is positioned by IBM as having up to four (4) times the performance of earlier generations of the storage system. In terms of speeds and feeds, the Gen3 XIV supports up to 180 2TB SAS hard disk drives (HDD) that provides up to 161TB of usable storage space capacity. For connectivity, the Gen3 XIV supports up to 24 8Gb Fibre Channel (8GFC) or for iSCSI 22 1Gb Ethernet (1 GbE) ports with a total of up to 360GBytes of system cache. In addition to the large cache to boost performance, other enhancements include leveraging multi core processors along with an internal InfiniBand  network to connect nodes replacing the former 1 GbE interconnect. Note, InfiniBand is only used to interconnect the various nodes in the XIV cluster and is not used for attachment to applications servers which is handled via iSCSI and Fibre Channel.

IBM and SPC storage performance history
IBM has a strong history if not leading the industry with benchmarking and workload simulation of their storage systems including Storage Performance Council (SPC) among others. The exception for IBM over the past couple of years has been the lack of SPC benchmarks for XIV. Last year when IBM released their new V7000 storage system benchmarks include SPC were available close to if not at the product launch. I have in the past commented about IBMs lack of SPC benchmarks for XIV to confirm their marketing claims given their history of publishing results for all of their other storage systems. Now that IBM has recently released SPC2 results for the XIV it is only fitting then that I compliment them for doing so.

Benchmark brouhaha
Performance workload simulation results can often lead to applies and oranges comparisons or benchmark brouhaha battles or storage performance games. For example a few years back NetApp submitted a SPC performance result on behalf of their competitor EMC. Now to be clear on something, Im not saying that SPC is the best or definitive benchmark or comparison tool for storage or other purpose as it is not. However it is representative and most storage vendors have released some SPC results for their storage systems in addition to TPC and Microsoft ESRP among others. SPC2 is focused on streaming such as video, backup or other throughput centric applications where SPC1 is centered around IOPS or transactional activity. The metrics for SPC2 are Megabytes per second (MBps) for large file processing (LFP), large database query (LDQ) and video on demand delivery (VOD) for a given price and protection level.

What is the best benchmark?
Simple, your own application in as close to as actual workload activity as possible. If that is not possible, then some simulation or workload simulation that closets resembles your needs.

Does this mean that XIV is still relevant?
Yes

Does this mean that XIV G3 should be used for every environment?
Generally speaking no. However its performance enhancements should allow it to be considered for more applications than in the past. Plus with the public comparisons now available, that should help to silence questions (including those from me) about what the systems can really do vs. marketing claims.

How does XIV compare to some other IBM storage systems using SPC2 comparisons?

System
SPC2 MBps
Cost per SPC2
Storage GBytes
Price tested
Discount
Protection
DS5300
5,634.17
$74.13
16,383
417,648
0%
R5
V7000
3,132.87
$71.32
29,914
$223,422
38-39%
R5
XIV G3
7,467.99
$152.34
154,619
1,137,641
63-64%
Mirror
DS8800
9,705.74
$270.38
71,537
2,624,257
40-50%
R5

In the above comparisons, the DS5300 (NetApp/Engenio based) is a dual controller (4GB of cache per controller) with 128 x 146.8GB 15K HDDs configured as RAID 5 with no discount applied to the price submitted. The V7000 system which is based on the IBM SVC along with other enhancements consists of dual controllers each with 8GB of cache and 120 x 10K 300GB HDDs configured as RAID 5 with just under a 40% discount off list price for system tested. For the XIV Gen3 system tested, discount off list price for the submission is about 63% with 15 nodes and a total of 360GB of cache and 180 2TB 7.2K SAS HDDs configured as mirrors. The DS8800 system with dual controllers has a 256GB of cache, 768 x 146GB 15K HDDs configured in RAID5 with a discount between 40 to 50% off of list.

What the various metrics do not show is the benefit of various features and functionality which should be considered to your particular needs. Likewise, if your applications are not centered around bandwidth or throughput, then the above performance comparisons would not be relevant. Also note that the systems above have various discount prices as submitted which can be a hint to a smart shopper where to begin negotiations at. You can also do some analysis of the various systems based on their performance, configuration, physical footprint, functionality and cost plus the links below take you to the complete reports with more information.

DS8800 SPC2 executive summary and full disclosure report

XIV SPC2 executive summary and full disclosure report

DS5300 SPC2 executive summary and full disclosure report

V7000 SPC2 executive summary and full disclosure report

Bottom line, benchmarks and performance comparisons are just that, a comparison that may or may not be relevant to your particular needs. Consequently they should be used as a tool combined with other information to see how a particular solution might be a fit for your specific needs. The best benchmark however is your own application running as close to possible realistic workload to get a representative perspective of a systems capabilities.

Ok, nuff said
Cheers gs

Greg Schulz – Author Cloud and Virtual Data Storage Networking (CRC Press, 2011), The Green and Virtual Data Center (CRC Press, 2009), and Resilient Storage Networks (Elsevier, 2004)

twitter @storageio

All Comments, (C) and (TM) belong to their owners/posters, Other content (C) Copyright 2006-2011 StorageIO and UnlimitedIO All Rights Reserved

Measuring Windows performance impact for VDI planning

Here is a link to a recent guest post that I was invited to do over at The Virtualization Practice (TVP) pertaining to measuring the impact of Windows Boot performance and what that means for planning for Virtual Desktop Infrastructure (VDI) initiatives.

With Virtual Desktop Infrastructures (VDI) initiatives adoption being a popular theme associated with cloud and dynamic infrastructure environments a related discussion point is the impact on networks, servers and storage during boot or startup activity to avoid bottlenecks. VDI solution vendors include Citrix, Microsoft and VMware along with various server, storage, networking and management tools vendors.

A common storage and network related topic involving VDI are boot storms when many workstations or desktops all startup at the same time. However any discussion around VDI and its impact on networks, servers and storage should also be expanded from read centric boots to write intensive shutdown or maintenance activity as well.

Having an understanding of what your performance requirements are is important to adequately design a configuration that will meet your Quality of Service (QoS) and service level objectives (SLOs) for VDI deployment in addition to knowing what to look for in candidate server, storage and networking technologies. For example, knowing how your different desktop applications and workloads perform on a normal basis provides a baseline to compare with during busy periods or times of trouble. Another benefit is that when shopping for example storage systems and reviewing various benchmarks, knowing what your actual performance and application characteristics are helps to align the applicable technology to your QoS and SLO needs while avoiding apples to oranges benchmark comparisons.

Check out the entire piece including some test results using the hIOmon tool from hyperIO to gather actual workstation performance numbers.

Keep in mind that the best benchmark is your actual applications running as close to possible to their typical workload and usage scenarios.

Also keep in mind that fast workstations need fast networks, fast servers and fast storage.

Ok, nuff said for now.

Cheers gs

Greg Schulz – Author Cloud and Virtual Data Storage Networking (CRC Press, 2011), The Green and Virtual Data Center (CRC Press, 2009), and Resilient Storage Networks (Elsevier, 2004)

twitter @storageio

All Comments, (C) and (TM) belong to their owners/posters, Other content (C) Copyright 2006-2011 StorageIO and UnlimitedIO All Rights Reserved

EPA Energy Star for Data Center Storage Update

EPA Energy Star

Following up on a recent post about Green IT, energy efficiency and optimization for servers, storage and more, here are some additional  thoughts, perspectives along with industry activity around the U.S. Environmental Protection Agency (EPA) Energy Star for Server, Data Center Storage and Data Centers.

First a quick update, Energy Star for Servers is in place with work now underway on expanding and extending beyond the first specification. Second is that Energy Star for Data Center storage definition is well underway including a recent workshop to refine the initial specification along with discussion for follow-on drafts.

Energy Star for Data Centers is also currently undergoing definition which is focused more on macro or facility energy (notice I did not say electricity) efficiency as opposed to productivity or effectiveness, items that the Server and Storage specifications are working towards.

Among all of the different industry trade or special interests groups, at least on the storage front the Storage Networking Industry Association (SNIA) Green Storage Initiative (GSI) and their Technical Work Groups (TWG) have been busily working for the past couple of years on taxonomies, metrics and other items in support of EPA Energy Star for Data Center Storage.

A challenge for SNIA along with others working on related material pertaining to storage and efficiency is the multi-role functionality of storage. That is, some storage simply stores data with little to no performance requirements while other storage is actively used for reading and writing. In addition, there are various categories, architectures not to mention hardware and software feature functionality or vendors with different product focus and interests.

Unlike servers that are either on and doing work, or, off or in low power mode, storage is either doing active work (e.g. moving data), storing in-active or idle data, or a combination of both. Hence for some, energy efficiency is about how much data can be stored in a given footprint with the least amount of power known as in-active or idle measurement.

On the other hand, storage efficiency is also about using the least amount of energy to produce the most amount of work or activity, for example IOPS or bandwidth per watt per footprint.

Thus the challenge and need for at least a two dimensional  model looking at, and reflecting different types or categories of storage aligned for active or in-active (e.g. storing) data enabling apples to apples, vs. apples to oranges comparison.

This is not all that different from how EPA looks at motor vehicle categories of economy cars, sport utility, work or heavy utility among others when doing different types of work, or, in idle.

What does this have to do with servers and storage?

Simple, when a server powers down where does its data go? That’s right, to a storage system using disk, ssd (RAM or flash), tape or optical for persistency. Likewise, when there is work to be done, where does the data get read into computer memory from, or written to? That’s right, a storage system. Hence the need to look at storage in a multi-tenant manner.

The storage industry is diverse with some vendors or products focused on performance or activity, while others on long term, low cost persistent storage for archive, backup, not to mention some doing a bit of both. Hence the nomenclature of herding cats towards a common goal when different parties have various interests that may conflict yet support needs of various customer storage usage requirements.

Figure 1 shows a simplified, streamlined storage taxonomy that has been put together by SNIA representing various types, categories and functions of data center storage. The green shaded areas are a good step in the right direction to simplify yet move towards realistic and achievable befits for storage consumers.


Figure 1 Source: EPA Energy Star for Data Center Storage web site document

The importance of the streamlined SNIA taxonomy is to help differentiate or characterize various types and tiers of storage (Figure 2) products facilitating apples to apples comparison instead of apples or oranges. For example, on-line primary storage needs to be looked at in terms of how much work or activity per energy footprint determines efficiency.


Figure 2: Tiered Storage Example

On other hand, storage for retaining large amounts of data that is in-active or idle for long periods of time should be looked at on a capacity per energy footprint basis. While final metrics are still being flushed out, some examples could be active storage gauged by IOPS or work or bandwidth per watt of energy per footprint while other storage for idle or inactive data could be looked at on a capacity per energy footprint basis.

What benchmarks or workloads to be used for simulating or measuring work or activity are still being discussed with proposals coming from various sources. For example SNIA GSI TWG are developing measurements and discussing metrics, as have the storage performance council (SPC) and SPEC among others including use of simulation tools such as IOmeter, VMware VMmark, TPC, Bonnie, or perhaps even Microsoft ESRP.

Tenants of Energy Star for Data Center Storage overtime hopefully will include:

  • Reflective of different types, categories, price-bands and storage usage scenarios
  • Measure storage efficiency for active work along with in-active or idle usage
  • Provide insight for both storage performance efficiency and effective capacity
  • Baseline or raw storage capacity along with effective enhanced optimized capacity
  • Easy to use metrics with more in-depth back ground or disclosure information

Ultimately the specification should help IT storage buyers and decision makers to compare and contrast different storage systems that are best suited and applicable to their usage scenarios.

This means measuring work or activity per energy footprint at a given capacity and data protection level to meet service requirements along with during in-active or idle periods. This also means showing storage that is capacity focused in terms of how much data can be stored in a given energy footprint.

One thing that will be tricky however will be differentiating GBytes per watt in terms of capacity, or, in terms of performance and bandwidth.

Here are some links to learn more:

Stay tuned for more on Energy Star for Data Centers, Servers and Data Center Storage.

Ok, nuff said.

Cheers gs

Greg Schulz – Author Cloud and Virtual Data Storage Networking (CRC Press), The Green and Virtual Data Center (CRC Press) and Resilient Storage Networks (Elsevier)
twitter @storageio

All Comments, (C) and (TM) belong to their owners/posters, Other content (C) Copyright 2006-2024 Server StorageIO and UnlimitedIO LLC All Rights Reserved

Was today the proverbal day that he!! froze over?

Storage I/O trends

The upper Midwest, well, make that the Midwest in general was hit by high winds and a nasty cold front today, nothing all that unusual for January, especially in the Minneapolis area where the temperature yesterday was 40 to 45 with light rain and by about noon today about zero “F” without the wind chill. So in the face of old man winter and the cold, I had a chuckle today reading the announcement that an SPC (Storage Performance Council) SPC1 (IOPS) benchmark had finally been published for an EMC CLARiiON CX3-40.

Now for those of you who cover or track or cheerlead or dread EMC, you probably know there position on benchmarks, or at least of some of their bloggers and in particular, SPC and if not, read here for some perspective. My position has always been the best benchmark is your actual application in a real and applicable workload scenario, however also realizing that not everybody can simulate or test their applications, there is the need for points of reference comparison benchmarks such as SPC, Microsoft ESRP, TPC, SPEC among others.

Heres’ the caveat, take these benchmarks with a grain of salt; use them as a gauge along with other tools as they are an indicator of a particular workload. I am a fan of benchmarks that make sense, can be reproduced consistently and that are realistic representations, not a substitute for your actual applications. They are tools to help you make a better informed decision however that is all they are, a relative comparison.

Nuff rambling for now on that, why did I chuckle this morning and think that He!! had perhaps finally froze over, and don?t get me wrong, Minneapolis and the Midwest for that matter is far from being He!!!, granted its cold as crap during the winter months. The reason I chuckled is that EMC did not in fact submit the SPC1 benchmarks for the CLARiiON CX3-40, instead, one of their competitors namely Network Appliance (aka NetApp) did the honors for EMC along with a submission for their FAS3040.

So besides the fact that there is plenty of wiggle and debate room in the test for example NetApp using RAID6 (e.g. RAID-DP) and Mirroring on the EMC (I?m sure we will hear EMC cry foul), EMC can keep their hands clean on their party line about not submitting an SPC1 result, or at least that?s a card they could choose to play.I would like to see the DMX4 particularly with the new FLASH based SSDs in a future SPC test submission; however, I?m not going to hold my breath at least yet.

However it is ironic that EMC has in fact submitted other benchmark tests scenarios in the past including for Microsoft ESRP among others. Speaking of SPC submissions, TMS (Texas Memory Systems) also posted some new SPC results the other day.So maybe he!! did not really freeze over today with EMC finally submitting an SPC test, however it made for good warming chuckle on a cold morning.

Now, even though EMC has not officially submitted the SPC1 result, even though it is posted on the SPC website, that leaves only one major storage vendor yet to have their midrange open storage systems represented on the SPC results, and that would be HDS with their AMS series, maybe He!! will still freeze over…

Cheers

Greg Schulz – www.storageio.com