Data Protection Diaries – My data protection needs and wants

Storage I/O trends

Blog post: Data Protection Diaries – My data protection needs and wants

Update 1/10/18

Rather than talking about what others should do or consider for their data protection needs, for this post I wrote down some notes using my Livescribe about what I need and want for my environment. As part of walking the talk in future posts I’m going to expand a bit more on what I’m doing as well as considering for enhancements to my environment for data protection which consists of cloud, virtual and physical.

Why and what am I Protecting?

live scribe example
Livescribe notes that I used for creating the following content

What is my environment

Server and StorageIO (aka StorageIO) is a small business that is focused in and around data infrastructures which includes data protection as a result, have lots of data including videos, audio, images, presentations, reports, research as well, file serving as back-office applications.  Then there are websites, blog, email and related applications, some of which are cloud based that are also part of my environment that have different availability, durable, and accessibility requirements.

My environment includes local on-site physical as well as virtual systems, mobile devices, as well as off-site resources including a dedicated private server (DPS) at a service provider. On one hand as a small business, I could easily move most if not everything into the cloud using an as a service model. However, I also have a lab and research environment for doing various things involving data infrastructure including data protection so why not leverage those for other things.

Why do I need to protect my information and data infrastructure?

  • Protect and preserve the business along with associated information as well as assets
  • Compliance (self and client based, PCI and other)
  • Security (logical and physical) and privacy to guard against theft, loss, instrusions
  • Logical (corruption, virus, accidental deletion) and physical damage to systems, devices, applications and data
  • Isolate and contain faults of hardware, software, networks, people actions from spreading to disasters
  • Guard against on-site or off-site incidents, acts of man or nature, head-line news and non head-line news
  • Address previous experience, incidents and situations, preventing future issues or problems
  • Support growth while enabling agility, flexibity
  • Walk the talk, research, learning increasing experience

My wants – What I would like to have

  • Somebody else pay for it all, or exist in world where there are no threat risks to information (yeh right ;) )
  • Cost effective and value (not necessarily the cheapest, I also want it to work)
  • High availability and durability to protect against different threat risks (including myself)
  • Automated, magically to take care of everything enabled by unicorns and pixie dust ;).

My requirements – What I need (vs. want):

  • Support mix of physical, virtual and cloud applications, systems and data
  • Different applications and data, local and some that are mobile
  • Various operating environments including Windows and Linux
  • NOT have to change my environment to meet limits of a particular solution or approach
  • Need a solution (s) that fit my needs and that can scale, evolve as well as enable change when my environment does
  • Also leverage what I have while supporting new things

Data protection topics, trends, technologies and related themes

Wrap and summary (for now)

Taking a step back to look at a high-level of what my data protection needs are involves looking at business requirements along with various threat risks, not to mention technical considerations. In a future post I will outline what I am doing as well as considering for enhancements or other changes along with different tools, technologies used in hybrid ways. Watch for more posts in this ongoing series of the data protection dairies via www.storageioblog.com/data-protection-diaries-main/.

Ok, nuff said (for now)

Cheers
Gs

Greg Schulz – Author Cloud and Virtual Data Storage Networking (CRC Press), The Green and Virtual Data Center (CRC Press) and Resilient Storage Networks (Elsevier)
twitter @storageio

All Comments, (C) and (TM) belong to their owners/posters, Other content (C) Copyright 2006-2024 Server StorageIO and UnlimitedIO LLC All Rights Reserved

Can we get a side of context with them IOPS server storage metrics?

Can we get a side of context with them server storage metrics?

Storage I/O trends

Updated 2/10/2018

Whats the best server storage I/O network metric or benchmark? It depends as there needs to be some context with them IOPS and other server storage I/O metrics that matter.

There is an old saying that the best I/O (Input/Output) is the one that you do not have to do.

In the meantime, let’s get a side of some context with them IOPS from vendors, marketers and their pundits who are tossing them around for server, storage and IO metrics that matter.

Expanding the conversation, the need for more context

The good news is that people are beginning to discuss storage beyond space capacity and cost per GByte, TByte or PByte for both DRAM or nand flash Solid State Devices (SSD), Hard Disk Drives (HDD) along with Hybrid HDD (HHDD) and Solid State Hybrid Drive (SSHD) based solutions. This applies to traditional enterprise or SMB IT data center with physical, virtual or cloud based infrastructures.

hdd and ssd iops

This is good because it expands the conversation beyond just cost for space capacity into other aspects including performance (IOPS, latency, bandwidth) for various workload scenarios along with availability, energy effective and management.

Adding a side of context

The catch is that IOPS while part of the equation are just one aspect of performance and by themselves without context, may have little meaning if not misleading in some situations.

Granted it can be entertaining, fun to talk about or simply make good press copy for a million IOPS. IOPS vary in size depending on the type of work being done, not to mention reads or writes, random and sequential which also have a bearing on data throughout or bandwidth (Mbytes per second) along with response time.

However, are those million IOP’s applicable to your environment or needs?

Likewise, what do those million or more IOPS represent about type of work being done? For example, are they small 64 byte or large 64 Kbyte sized, random or sequential, cached reads or lazy writes (deferred or buffered) on a SSD or HDD?

How about the response time or latency for achieving them IOPS?

In other words, what is the context of those metrics and why do they matter?

storage i/o iops
Click on image to view more metrics that matter including IOP’s for HDD and SSD’s

Metrics that matter give context for example IO sizes closer to what your real needs are, reads and writes, mixed workloads, random or sequential, sustained or bursty, in other words, real world reflective.

As with any benchmark take them with a grain (or more) of salt, they key is use them as an indicator then align to your needs. The tool or technology should work for you, not the other way around.

Here are some examples of context that can be added to help make IOP’s and other metrics matter:

  • What is the IOP size, are they 512 byte (or smaller) vs. 4K bytes (or larger)?
  • Are they reads, writes, random, sequential or mixed and what percentage?
  • How was the storage configured including RAID, replication, erasure or dispersal codes?
  • Then there is the latency or response time and IO queue depths for the given number of IOPS.
  • Let us not forget if the storage systems (and servers) were busy with other work or not.
  • If there is a cost per IOP, is that list price or discount (hint, if discount start negotiations from there)
  • What was the number of threads or workers, along with how many servers?
  • What tool was used, its configuration, as well as raw or cooked (aka file system) IO?
  • Was the IOP’s number with one worker or multiple workers on a single or multiple servers?
  • Did the IOP’s number come from a single storage system or total of multiple systems?
  • Fast storage needs fast serves and networks, what was their configuration?
  • Was the performance a short burst, or long sustained period?
  • What was the size of the test data used; did it all fit into cache?
  • Were short stroking for IOPS or long stroking for bandwidth techniques used?
  • Data footprint reduction (DFR) techniques (thin provisioned, compression or dedupe) used?
  • Were write data committed synchronously to storage, or deferred (aka lazy writes used)?

The above are just a sampling and not all may be relevant to your particular needs, however they help to put IOP’s into more contexts. Another consideration around IOPS are the configuration of the environment, from an actual running application using some measurement tool, or are they generated from a workload tool such as IOmeter, IOrate, VDbench among others.

Sure, there are more contexts and information that would be interesting as well, however learning to walk before running will help prevent falling down.

Storage I/O trends

Does size or age of vendors make a difference when it comes to context?

Some vendors are doing a good job of going for out of this world record-setting marketing hero numbers.

Meanwhile other vendors are doing a good job of adding context to their IOP or response time or bandwidth among other metrics that matter. There is a mix of startup and established that give context with their IOP’s or other metrics, likewise size or age does not seem to matter for those who lack context.

Some vendors may not offer metrics or information publicly, so fine, go under NDA to learn more and see if the results are applicable to your environments.

Likewise, if they do not want to provide the context, then ask some tough yet fair questions to decide if their solution is applicable for your needs.

Storage I/O trends

Where To Learn More

View additional NAS, NVMe, SSD, NVM, SCM, Data Infrastructure and HDD related topics via the following links.

Additional learning experiences along with common questions (and answers), as well as tips can be found in Software Defined Data Infrastructure Essentials book.

Software Defined Data Infrastructure Essentials Book SDDC

What This All Means

What this means is let us start putting and asking for metrics that matter such as IOP’s with context.

If you have a great IOP metric, if you want it to matter than include some context such as what size (e.g. 4K, 8K, 16K, 32K, etc.), percentage of reads vs. writes, latency or response time, random or sequential.

IMHO the most interesting or applicable metrics that matter are those relevant to your environment and application. For example if your main application that needs SSD does about 75% reads (random) and 25% writes (sequential) with an average size of 32K, while fun to hear about, how relevant is a million 64 byte read IOPS? Likewise when looking at IOPS, pay attention to the latency, particular if SSD or performance is your main concern.

Get in the habit of asking or telling vendors or their surrogates to provide some context with them metrics if you want them to matter.

So how about some context around them IOP’s (or latency and bandwidth or availability for that matter)?

Ok, nuff said, for now.

Gs

Greg Schulz – Microsoft MVP Cloud and Data Center Management, VMware vExpert 2010-2017 (vSAN and vCloud). Author of Software Defined Data Infrastructure Essentials (CRC Press), as well as Cloud and Virtual Data Storage Networking (CRC Press), The Green and Virtual Data Center (CRC Press), Resilient Storage Networks (Elsevier) and twitter @storageio. Courteous comments are welcome for consideration. First published on https://storageioblog.com any reproduction in whole, in part, with changes to content, without source attribution under title or without permission is forbidden.

All Comments, (C) and (TM) belong to their owners/posters, Other content (C) Copyright 2006-2024 Server StorageIO and UnlimitedIO. All Rights Reserved. StorageIO is a registered Trade Mark (TM) of Server StorageIO.

Part II: How many IOPS can a HDD HHDD SSD do with VMware?

How many IOPS can a HDD HHDD SSD do with VMware?

server storage data infrastructure i/o iop hdd ssd trends

Updated 2/10/2018

This is the second post of a two-part series looking at storage performance, specifically in the context of drive or device (e.g. mediums) characteristics of How many IOPS can a HDD HHDD SSD do with VMware. In the first post the focus was around putting some context around drive or device performance with the second part looking at some workload characteristics (e.g. benchmarks).

A common question is how many IOPS (IO Operations Per Second) can a storage device or system do?

The answer is or should be it depends.

Here are some examples to give you some more insight.

For example, the following shows how IOPS vary by changing the percent of reads, writes, random and sequential for a 4K (4,096 bytes or 4 KBytes) IO size with each test step (4 minutes each).

IO Size for test
Workload Pattern of test
Avg. Resp (R+W) ms
Avg. IOP Sec (R+W)
Bandwidth KB Sec (R+W)
4KB
100% Seq 100% Read
0.0
29,736
118,944
4KB
60% Seq 100% Read
4.2
236
947
4KB
30% Seq 100% Read
7.1
140
563
4KB
0% Seq 100% Read
10.0
100
400
4KB
100% Seq 60% Read
3.4
293
1,174
4KB
60% Seq 60% Read
7.2
138
554
4KB
30% Seq 60% Read
9.1
109
439
4KB
0% Seq 60% Read
10.9
91
366
4KB
100% Seq 30% Read
5.9
168
675
4KB
60% Seq 30% Read
9.1
109
439
4KB
30% Seq 30% Read
10.7
93
373
4KB
0% Seq 30% Read
11.5
86
346
4KB
100% Seq 0% Read
8.4
118
474
4KB
60% Seq 0% Read
13.0
76
307
4KB
30% Seq 0% Read
11.6
86
344
4KB
0% Seq 0% Read
12.1
82
330

Dell/Western Digital (WD) 1TB 7200 RPM SATA HDD (Raw IO) thread count 1 4K IO size

In the above example the drive is a 1TB 7200 RPM 3.5 inch Dell (Western Digital) 3Gb SATA device doing raw (non file system) IO. Note the high IOP rate with 100 percent sequential reads and a small IO size which might be a result of locality of reference due to drive level cache or buffering.

Some drives have larger buffers than others from a couple to 16MB (or more) of DRAM that can be used for read ahead caching. Note that this level of cache is independent of a storage system, RAID adapter or controller or other forms and levels of buffering.

Does this mean you can expect or plan on getting those levels of performance?

I would not make that assumption, and thus this serves as an example of using metrics like these in the proper context.

Building off of the previous example, the following is using the same drive however with a 16K IO size.

IO Size for test
Workload Pattern of test
Avg. Resp (R+W) ms
Avg. IOP Sec (R+W)
Bandwidth KB Sec (R+W)
16KB
100% Seq 100% Read
0.1
7,658
122,537
16KB
60% Seq 100% Read
4.7
210
3,370
16KB
30% Seq 100% Read
7.7
130
2,080
16KB
0% Seq 100% Read
10.1
98
1,580
16KB
100% Seq 60% Read
3.5
282
4,522
16KB
60% Seq 60% Read
7.7
130
2,090
16KB
30% Seq 60% Read
9.3
107
1,715
16KB
0% Seq 60% Read
11.1
90
1,443
16KB
100% Seq 30% Read
6.0
165
2,644
16KB
60% Seq 30% Read
9.2
109
1,745
16KB
30% Seq 30% Read
11.0
90
1,450
16KB
0% Seq 30% Read
11.7
85
1,364
16KB
100% Seq 0% Read
8.5
117
1,874
16KB
60% Seq 0% Read
10.9
92
1,472
16KB
30% Seq 0% Read
11.8
84
1,353
16KB
0% Seq 0% Read
12.2
81
1,310

Dell/Western Digital (WD) 1TB 7200 RPM SATA HDD (Raw IO) thread count 1 16K IO size

The previous two examples are excerpts of a series of workload simulation tests (ok, you can call them benchmarks) that I have done to collect information, as well as try some different things out.

The following is an example of the summary for each test output that includes the IO size, workload pattern (reads, writes, random, sequential), duration for each workload step, totals for reads and writes, along with averages including IOP’s, bandwidth and latency or response time.

disk iops

Want to see more numbers, speeds and feeds, check out the following table which will be updated with extra results as they become available.

Device
Vendor
Make

Model

Form Factor
Capacity
Interface
RPM Speed
Raw
Test Result
HDD
HGST
Desktop
HK250-160
2.5
160GB
SATA
5.4K
HDD
Seagate
Mobile
ST2000LM003
2.5
2TB
SATA
5.4K
HDD
Fujitsu
Desktop
MHWZ160BH
2.5
160GB
SATA
7.2K
HDD
Seagate
Momentus
ST9160823AS
2.5
160GB
SATA
7.2K
HDD
Seagate
MomentusXT
ST95005620AS
2.5
500GB
SATA
7.2K(1)
HDD
Seagate
Barracuda
ST3500320AS
3.5
500GB
SATA
7.2K
HDD
WD/Dell
Enterprise
WD1003FBYX
3.5
1TB
SATA
7.2K
HDD
Seagate
Barracuda
ST3000DM01
3.5
3TB
SATA
7.2K
HDD
Seagate
Desktop
ST4000DM000
3.5
4TB
SATA
HDD
HDD
Seagate
Capacity
ST6000NM00
3.5
6TB
SATA
HDD
HDD
Seagate
Capacity
ST6000NM00
3.5
6TB
12GSAS
HDD
HDD
Seagate
Savio 10K.3
ST9300603SS
2.5
300GB
SAS
10K
HDD
Seagate
Cheetah
ST3146855SS
3.5
146GB
SAS
15K
HDD
Seagate
Savio 15K.2
ST9146852SS
2.5
146GB
SAS
15K
HDD
Seagate
Ent. 15K
ST600MP0003
2.5
600GB
SAS
15K
SSHD
Seagate
Ent. Turbo
ST600MX0004
2.5
600GB
SAS
SSHD
SSD
Samsung
840 PRo
MZ-7PD256
2.5
256GB
SATA
SSD
HDD
Seagate
600 SSD
ST480HM000
2.5
480GB
SATA
SSD
SSD
Seagate
1200 SSD
ST400FM0073
2.5
400GB
12GSAS
SSD

Performance characteristics 1 worker (thread count) for RAW IO (non-file system)

Note: (1) Seagate Momentus XT is a Hybrid Hard Disk Drive (HHDD) based on a 7.2K 2.5 HDD with SLC nand flash integrated for read buffer in addition to normal DRAM buffer. This model is a XT I (4GB SLC nand flash), may add an XT II (8GB SLC nand flash) at some future time.

As a starting point, these results are raw IO with file system based information to be added soon along with more devices. These results are for tests with one worker or thread count, other results will be added with such as 16 workers or thread counts to show how those differ.

The above results include all reads, all writes, mix of reads and writes, along with all random, sequential and mixed for each IO size. IO sizes include 4K, 8K, 16K, 32K, 64K, 128K, 256K, 512K, 1024K and 2048K. As with any workload simulation, benchmark or comparison test, take these results with a grain of salt as your mileage can and will vary. For example you will see some what I consider very high IO rates with sequential reads even without file system buffering. These results might be due to locality of reference of IO’s being resolved out of the drives DRAM cache (read ahead) which vary in size for different devices. Use the vendor model numbers in the table above to check the manufactures specs on drive DRAM and other attributes.

If you are used to seeing 4K or 8K and wonder why anybody would be interested in some of the larger sizes take a look at big fast data or cloud and object storage. For some of those applications 2048K may not seem all that big. Likewise if you are used to the larger sizes, there are still applications doing smaller sizes. Sorry for those who like 512 byte or smaller IO’s as they are not included. Note that for all of these unless indicated a 512 byte standard sector or drive format is used as opposed to emerging Advanced Format (AF) 4KB sector or block size. Watch for some more drive and device types to be added to the above, along with results for more workers or thread counts, along with file system and other scenarios.

Using VMware as part of a Server, Storage and IO (aka StorageIO) test platform

vmware vexpert

The above performance results were generated on Ubuntu 12.04 (since upgraded to 14.04 which was hosted on a VMware vSphere 5.1 (upgraded to 5.5U2) purchased version (you can get the ESXi free version here) with vCenter enabled system. I also have VMware workstation installed on some of my Windows-based laptops for doing preliminary testing of scripts and other activity prior to running them on the larger server-based VMware environment. Other VMware tools include vCenter Converter, vSphere Client and CLI. Note that other guest virtual machines (VMs) were idle during the tests (e.g. other guest VMs were quiet). You may experience different results if you ran Ubuntu native on a physical machine or with different adapters, processors and device configurations among many other variables (that was a disclaimer btw ;) ).

Storage I/O trends

All of the devices (HDD, HHDD, SSD’s including those not shown or published yet) were Raw Device Mapped (RDM) to the Ubuntu VM bypassing VMware file system.

Example of creating an RDM for local SAS or SATA direct attached device.

vmkfstools -z /vmfs/devices/disks/naa.600605b0005f125018e923064cc17e7c /vmfs/volumes/dat1/RDM_ST1500Z110S6M5.vmdk

The above uses the drives address (find by doing a ls -l /dev/disks via VMware shell command line) to then create a vmdk container stored in a dat. Note that the RDM being created does not actually store data in the .vmdk, it’s there for VMware management operations.

If you are not familiar with how to create a RDM of a local SAS or SATA device, check out this post to learn how.This is important to note in that while VMware was used as a platform to support the guest operating systems (e.g. Ubuntu or Windows), the real devices are not being mapped through or via VMware virtual drives.

vmware iops

The above shows examples of RDM SAS and SATA devices along with other VMware devices and dats. In the next figure is an example of a workload being run in the test environment.

vmware iops

One of the advantages of using VMware (or other hypervisor) with RDM’s is that I can quickly define via software commands where a device gets attached to different operating systems (e.g. the other aspect of software defined storage). This means that after a test run, I can quickly simply shutdown Ubuntu, remove the RDM device from that guests settings, move the device just tested to a Windows guest if needed and restart those VMs. All of that from where ever I happen to be working from without physically changing things or dealing with multi-boot or cabling issues.

Where To Learn More

View additional NAS, NVMe, SSD, NVM, SCM, Data Infrastructure and HDD related topics via the following links.

Additional learning experiences along with common questions (and answers), as well as tips can be found in Software Defined Data Infrastructure Essentials book.

Software Defined Data Infrastructure Essentials Book SDDC

What This All Means

So how many IOPs can a device do?

That depends, however have a look at the above information and results.

Check back from time to time here to see what is new or has been added including more drives, devices and other related themes.

Ok, nuff said, for now.

Gs

Greg Schulz – Microsoft MVP Cloud and Data Center Management, VMware vExpert 2010-2017 (vSAN and vCloud). Author of Software Defined Data Infrastructure Essentials (CRC Press), as well as Cloud and Virtual Data Storage Networking (CRC Press), The Green and Virtual Data Center (CRC Press), Resilient Storage Networks (Elsevier) and twitter @storageio. Courteous comments are welcome for consideration. First published on https://storageioblog.com any reproduction in whole, in part, with changes to content, without source attribution under title or without permission is forbidden.

All Comments, (C) and (TM) belong to their owners/posters, Other content (C) Copyright 2006-2024 Server StorageIO and UnlimitedIO. All Rights Reserved. StorageIO is a registered Trade Mark (TM) of Server StorageIO.

How many I/O iops can flash SSD or HDD do?

How many i/o iops can flash ssd or hdd do with vmware?

sddc data infrastructure Storage I/O ssd trends

Updated 2/10/2018

A common question I run across is how many I/O iopsS can flash SSD or HDD storage device or system do or give.

The answer is or should be it depends.

This is the first of a two-part series looking at storage performance, and in context specifically around drive or device (e.g. mediums) characteristics across HDD, HHDD and SSD that can be found in cloud, virtual, and legacy environments. In this first part the focus is around putting some context around drive or device performance with the second part looking at some workload characteristics (e.g. benchmarks).

What about cloud, tape summit resources, storage systems or appliance?

Lets leave those for a different discussion at another time.

Getting started

Part of my interest in tools, metrics that matter, measurements, analyst, forecasting ties back to having been a server, storage and IO performance and capacity planning analyst when I worked in IT. Another aspect ties back to also having been a sys admin as well as business applications developer when on the IT customer side of things. This was followed by switching over to the vendor world involved with among other things competitive positioning, customer design configuration, validation, simulation and benchmarking HDD and SSD based solutions (e.g. life before becoming an analyst and advisory consultant).

Btw, if you happen to be interested in learn more about server, storage and IO performance and capacity planning, check out my first book Resilient Storage Networks (Elsevier) that has a bit of information on it. There is also coverage of metrics and planning in my two other books The Green and Virtual Data Center (CRC Press) and Cloud and Virtual Data Storage Networking (CRC Press). I have some copies of Resilient Storage Networks available at a special reader or viewer rate (essentially shipping and handling). If interested drop me a note and can fill you in on the details.

There are many rules of thumb (RUT) when it comes to metrics that matter such as IOPS, some that are older while others may be guess or measured in different ways. However the answer is that it depends on many things ranging from if a standalone hard disk drive (HDD), Hybrid HDD (HHDD), Solid State Device (SSD) or if attached to a storage system, appliance, or RAID adapter card among others.

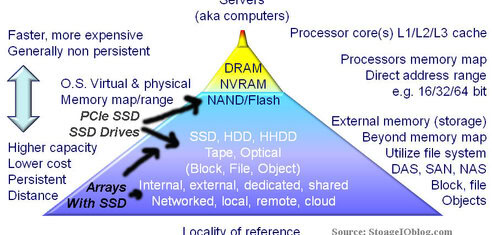
Taking a step back, the big picture

hdd image
Various HDD, HHDD and SSD’s

Server, storage and I/O performance and benchmark fundamentals

Even if just looking at a HDD, there are many variables ranging from the rotational speed or Revolutions Per Minute (RPM), interface including 1.5Gb, 3.0Gb, 6Gb or 12Gb SAS or SATA or 4Gb Fibre Channel. If simply using a RUT or number based on RPM can cause issues particular with 2.5 vs. 3.5 or enterprise and desktop. For example, some current generation 10K 2.5 HDD can deliver the same or better performance than an older generation 3.5 15K. Other drive factors (see this link for HDD fundamentals) including physical size such as 3.5 inch or 2.5 inch small form factor (SFF), enterprise or desktop or consumer, amount of drive level cache (DRAM). Space capacity of a drive can also have an impact such as if all or just a portion of a large or small capacity devices is used. Not to mention what the drive is attached to ranging from in internal SAS or SATA drive bay, USB port, or a HBA or RAID adapter card or in a storage system.

disk iops
HDD fundamentals

How about benchmark and performance for marketing or comparison tricks including delayed, deferred or asynchronous writes vs. synchronous or actually committed data to devices? Lets not forget about short stroking (only using a portion of a drive for better IOP’s) or even long stroking (to get better bandwidth leveraging spiral transfers) among others.

Almost forgot, there are also thick, standard, thin and ultra thin drives in 2.5 and 3.5 inch form factors. What’s the difference? The number of platters and read write heads. Look at the following image showing various thickness 2.5 inch drives that have various numbers of platters to increase space capacity in a given density. Want to take a wild guess as to which one has the most space capacity in a given footprint? Also want to guess which type I use for removable disk based archives along with for onsite disk based backup targets (compliments my offsite cloud backups)?

types of disks
Thick, thin and ultra thin devices

Beyond physical and configuration items, then there are logical configuration including the type of workload, large or small IOPS, random, sequential, reads, writes or mixed (various random, sequential, read, write, large and small IO). Other considerations include file system or raw device, number of workers or concurrent IO threads, size of the target storage space area to decide impact of any locality of reference or buffering. Some other items include how long the test or workload simulation ran for, was the device new or worn in before use among other items.

Tools and the performance toolbox

Then there are the various tools for generating IO’s or workloads along with recording metrics such as reads, writes, response time and other information. Some examples (mix of free or for fee) include Bonnie, Iometer, Iorate, IOzone, Vdbench, TPC, SPC, Microsoft ESRP, SPEC and netmist, Swifttest, Vmark, DVDstore and PCmark 7 among many others. Some are focused just on the storage system and IO path while others are application specific thus exercising servers, storage and IO paths.

performance tools
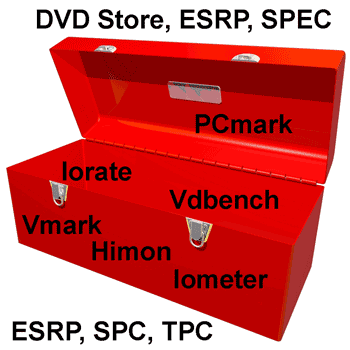
Server, storage and IO performance toolbox

Having used Iometer since the late 90s, it has its place and is popular given its ease of use. Iometer is also long in the tooth and has its limits including not much if any new development, never the less, I have it in the toolbox. I also have Futremark PCmark 7 (full version) which turns out has some interesting abilities to do more than exercise an entire Windows PC. For example PCmark can use a secondary drive for doing IO to.

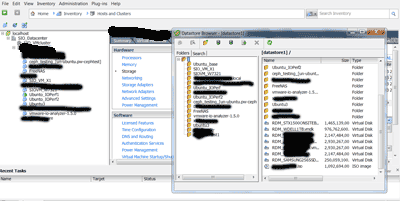
PCmark can be handy for spinning up with VMware (or other tools) lots of virtual Windows systems pointing to a NAS or other shared storage device doing real world type activity. Something that could be handy for testing or stressing virtual desktop infrastructures (VDI) along with other storage systems, servers and solutions. I also have Vdbench among others tools in the toolbox including Iorate which was used to drive the workloads shown below.

What I look for in a tool are how extensible are the scripting capabilities to define various workloads along with capabilities of the test engine. A nice GUI is handy which makes Iometer popular and yes there are script capabilities with Iometer. That is also where Iometer is long in the tooth compared to some of the newer generation of tools that have more emphasis on extensibility vs. ease of use interfaces. This also assumes knowing what workloads to generate vs. simply kicking off some IOPs using default settings to see what happens.

Another handy tool is for recording what’s going on with a running system including IO’s, reads, writes, bandwidth or transfers, random and sequential among other things. This is where when needed I turn to something like HiMon from HyperIO, if you have not tried it, get in touch with Tom West over at HyperIO and tell him StorageIO sent you to get a demo or trial. HiMon is what I used for doing start, stop and boot among other testing being able to see IO’s at the Windows file system level (or below) including very early in the boot or shutdown phase.

Here is a link to some other things I did awhile back with HiMon to profile some Windows and VDI activity test profiling.

What’s the best tool or benchmark or workload generator?

The one that meets your needs, usually your applications or something as close as possible to it.

disk iops
Various 2.5 and 3.5 inch HDD, HHDD, SSD with different performance

Where To Learn More

View additional NAS, NVMe, SSD, NVM, SCM, Data Infrastructure and HDD related topics via the following links.

Additional learning experiences along with common questions (and answers), as well as tips can be found in Software Defined Data Infrastructure Essentials book.

Software Defined Data Infrastructure Essentials Book SDDC

What This All Means

That depends, however continue reading part II of this series to see some results for various types of drives and workloads.

Ok, nuff said, for now.

Gs

Greg Schulz – Microsoft MVP Cloud and Data Center Management, VMware vExpert 2010-2017 (vSAN and vCloud). Author of Software Defined Data Infrastructure Essentials (CRC Press), as well as Cloud and Virtual Data Storage Networking (CRC Press), The Green and Virtual Data Center (CRC Press), Resilient Storage Networks (Elsevier) and twitter @storageio. Courteous comments are welcome for consideration. First published on https://storageioblog.com any reproduction in whole, in part, with changes to content, without source attribution under title or without permission is forbidden.

All Comments, (C) and (TM) belong to their owners/posters, Other content (C) Copyright 2006-2024 Server StorageIO and UnlimitedIO. All Rights Reserved. StorageIO is a registered Trade Mark (TM) of Server StorageIO.

What is the best kind of IO? The one you do not have to do

What is the best kind of IO? The one you do not have to do

data infrastructure server storage I/O trends

Updated 2/10/2018

What is the best kind of IO? If no IO (input/output) operation is the best IO, than the second best IO is the one that can be done as close to the application and processor with best locality of reference. Then the third best IO is the one that can be done in less time, or at least cost or impact to the requesting application which means moving further down the memory and storage stack (figure 1).

Storage and IO or I/O locality of reference and storage hirearchy
Figure 1 memory and storage hierarchy

The problem with IO is that they are basic operation to get data into and out of a computer or processor so they are required; however, they also have an impact on performance, response or wait time (latency). IO require CPU or processor time and memory to set up and then process the results as well as IO and networking resources to move data to their destination or retrieve from where stored. While IOs cannot be eliminated, their impact can be greatly improved or optimized by doing fewer of them via caching, grouped reads or writes (pre-fetch, write behind) among other techniques and technologies.

Think of it this way, instead of going on multiple errands, sometimes you can group multiple destinations together making for a shorter, more efficient trip; however, that optimization may also take longer. Hence sometimes it makes sense to go on a couple of quick, short low latency trips vs. one single larger one that takes half a day however accomplishes many things. Of course, how far you have to go on those trips (e.g. locality) makes a difference of how many you can do in a given amount of time.

What is locality of reference?

Locality of reference refers to how close (e.g location) data exists for where it is needed (being referenced) for use. For example, the best locality of reference in a computer would be registers in the processor core, then level 1 (L1), level 2 (L2) or level 3 (L3) onboard cache, followed by dynamic random access memory (DRAM). Then would come memory also known as storage on PCIe cards such as nand flash solid state device (SSD) or accessible via an adapter on a direct attached storage (DAS), SAN or NAS device. In the case of a PCIe nand flash SSD card, even though physically the nand flash SSD is closer to the processor, there is still the overhead of traversing the PCIe bus and associated drivers. To help offset that impact, PCIe cards use DRAM as cache or buffers for data along with Meta or control information to further optimize and improve locality of reference. In other words, help with cache hits, cache use and cache effectiveness vs. simply boosting cache utilization.

Where To Learn More

View additional NAS, NVMe, SSD, NVM, SCM, Data Infrastructure and HDD related topics via the following links.

Additional learning experiences along with common questions (and answers), as well as tips can be found in Software Defined Data Infrastructure Essentials book.

Software Defined Data Infrastructure Essentials Book SDDC

What This All Means

What can you do the cut the impact of IO

  • Establish baseline performance and availability metrics for comparison
  • Realize that IOs are a fact of IT virtual, physical and cloud life
  • Understand what is a bad IO along with its impact
  • Identify why an IO is bad, expensive or causing an impact
  • Find and fix the problem, either with software, application or database changes
  • Throw more software caching tools, hyper visors or hardware at the problem
  • Hardware includes faster processors with more DRAM and fast internal busses
  • Leveraging local PCIe flash SSD cards for caching or as targets
  • Utilize storage systems or appliances that have intelligent caching and storage optimization capabilities (performance, availability, capacity).
  • Compare changes and improvements to baseline, quantify improvement

Ok, nuff said, for now.

Gs

Greg Schulz – Microsoft MVP Cloud and Data Center Management, VMware vExpert 2010-2017 (vSAN and vCloud). Author of Software Defined Data Infrastructure Essentials (CRC Press), as well as Cloud and Virtual Data Storage Networking (CRC Press), The Green and Virtual Data Center (CRC Press), Resilient Storage Networks (Elsevier) and twitter @storageio. Courteous comments are welcome for consideration. First published on https://storageioblog.com any reproduction in whole, in part, with changes to content, without source attribution under title or without permission is forbidden.

All Comments, (C) and (TM) belong to their owners/posters, Other content (C) Copyright 2006-2024 Server StorageIO and UnlimitedIO. All Rights Reserved. StorageIO is a registered Trade Mark (TM) of Server StorageIO.

As the Hard Disk Drive HDD continues to spin

As the Hard Disk Drive HDD continues to spin

server storage data infrastructure i/o iop hdd ssd trends

Updated 2/10/2018

Despite having been repeatedly declared dead at the hands of some new emerging technology over the past several decades, the Hard Disk Drive (HDD) continues to spin and evolve as it moves towards its 60th birthday.

More recently HDDs have been declared dead due to flash SSD that according to some predictions, should have caused the HDD to be extinct by now.

Meanwhile, having not yet died in addition to having qualified for its AARP membership a few years ago, the HDD continues to evolve in capacity, smaller form factor, performance, reliability, density along with cost improvements.

Back in 2006 I did an article titled Happy 50th, hard drive, but will you make it to 60?

IMHO it is safe to say that the HDD will be around for at least a few more years if not another decade (or more).

This is not to say that the HDD has outlived its usefulness or that there are not other tiered storage mediums to do specific jobs or tasks better (there are).

Instead, the HDD continues to evolve and is complimented by flash SSD in a way that HDDs are complimenting magnetic tape (another declared dead technology) each finding new roles to support more data being stored for longer periods of time.

After all, there is no such thing as a data or information recession!

What the importance of this is about technology tiering and resource alignment, matching the applicable technology to the task at hand.

Technology tiering (Servers, storage, networking, snow removal) is about aligning the applicable resource that is best suited to a particular need in a cost as well as productive manner. The HDD remains a viable tiered storage medium that continues to evolve while taking on new roles coexisting with SSD and tape along with cloud resources. These and other technologies have their place which ideally is finding or expanding into new markets instead of simply trying to cannibalize each other for market share.

Here is a link to a good story by Lucas Mearian on the history or evolution of the hard disk drive (HDD) including how a 1TB device that costs about $60 today would have cost about a trillion dollars back in the 1950s. FWIW, IMHO the 1 trillion dollars is low and should be more around 2 to 5 trillion for the one TByte if you apply common costs for management, people, care and feeding, power, cooling, backup, BC, DR and other functions.

Where To Learn More

View additional NAS, NVMe, SSD, NVM, SCM, Data Infrastructure and HDD related topics via the following links.

Additional learning experiences along with common questions (and answers), as well as tips can be found in Software Defined Data Infrastructure Essentials book.

Software Defined Data Infrastructure Essentials Book SDDC

What This All Means

IMHO, it is safe to say that the HDD is here to stay for at least a few more years (if not decades) or at least until someone decides to try a new creative marketing approach by declaring it dead (again).

Ok, nuff said, for now.

Gs

Greg Schulz – Microsoft MVP Cloud and Data Center Management, VMware vExpert 2010-2017 (vSAN and vCloud). Author of Software Defined Data Infrastructure Essentials (CRC Press), as well as Cloud and Virtual Data Storage Networking (CRC Press), The Green and Virtual Data Center (CRC Press), Resilient Storage Networks (Elsevier) and twitter @storageio. Courteous comments are welcome for consideration. First published on https://storageioblog.com any reproduction in whole, in part, with changes to content, without source attribution under title or without permission is forbidden.

All Comments, (C) and (TM) belong to their owners/posters, Other content (C) Copyright 2006-2024 Server StorageIO and UnlimitedIO. All Rights Reserved. StorageIO is a registered Trade Mark (TM) of Server StorageIO.