Azure Stack Technical Preview 3 (TP3) Overview Preview Review

server storage I/O trends

Azure Stack Technical Preview 3 (TP3) Overview Preview Review

Perhaps you are aware or use Microsoft Azure, how about Azure Stack?

This is part one of a two-part series looking at Microsoft Azure Stack providing an overview, preview and review. Read part two here that looks at my experiences installing Microsoft Azure Stack Technical Preview 3 (TP3).

For those who are not aware, Azure Stack is a private on-premises extension of the Azure public cloud environment. Azure Stack now in technical preview three (e.g. TP3), or what you might also refer to as a beta (get the bits here).

In addition to being available via download as a preview, Microsoft is also working with vendors such as Cisco, Dell EMC, HPE, Lenovo and others who have announced Azure Stack support. Vendors such as Dell EMC have also made proof of concept kits available that you can buy including server with storage and software. Microsoft has also indicated that once launched for production versions scaling from a few to many nodes, that a single node proof of concept or development system will also remain available.

software defined data infrastructure SDDI and SDDC
Software-Defined Data Infrastructures (SDDI) aka Software-defined Data Centers, Cloud, Virtual and Legacy

Besides being an on-premises, private cloud variant, Azure Stack is also hybrid capable being able to work with public cloud Azure. In addition to working with public cloud Azure, Azure Stack services and in particular workloads can also work with traditional Microsoft, Linux and others. You can use pre built solutions from the Azure marketplace, in addition to developing your applications using Azure services and DevOps tools. Azure Stack enables hybrid deployment into public or private cloud to balance flexibility, control and your needs.

Azure Stack Overview

Microsoft Azure Stack is an on premise (e.g. in your own data center) private (or hybrid when connected to Azure) cloud platform. Currently Azure Stack is in Technical Preview 3 (e.g. TP3) and available as a proof of concept (POC) download from Microsoft. You can use Azure Stack TP3 as a POC for learning, demonstrating and trying features among other activities. Here is link to a Microsoft Video providing an overview of Azure Stack, and here is a good summary of roadmap, licensing and related items.

In summary, Microsoft Azure Stack is:

  • A onsite, on premise, in your data center extension of Microsoft Azure public cloud
  • Enabling private and hybrid cloud with strong integration along with common experiences with Azure
  • Adopt, deploy, leverage cloud on your terms and timeline choosing what works best for you
  • Common processes, tools, interfaces, management and user experiences
  • Leverage speed of deployment and configuration with a purpose-built integrate solution
  • Support existing and cloud native Windows, Linux, Container and other services
  • Available as a public preview via software download, as well as vendors offering solutions

What is Azure Stack Technical Preview 3 (TP3)

This version of Azure Stack is a single node running on a lone physical machine (PM) aka bare metal (BM). However can also be installed into a virtual machine (VM) using nesting. For example I have Azure Stack TP3 running nested on a VMware vSphere ESXi 6.5 systems with a Windows Server 2016 VM as its base operating system.

Microsoft Azure Stack architecture
Click here or on the above image to view list of VMs and other services (Image via Microsoft.com)

The TP3 POC Azure Stack is not intended for production environments, only for testing, evaluation, learning and demonstrations as part of its terms of use. This version of Azure Stack is associated with a single node identity such as Azure Active Directory (AAD) integrated with Azure, or Active Directory Federation Services (ADFS) for standalone modes. Note that since this is a single server deployment, it is not intended for performance, rather, for evaluating functionality, features, APIs and other activities. Learn more about Azure Stack TP3 details here (or click on image) including names of various virtual machines (VMs) as well as their roles.

Where to learn more

The following provide more information and insight about Azure, Azure Stack, Microsoft and Windows among related topics.

  • Azure Stack Technical Preview 3 (TP3) Overview Preview Review
  • Azure Stack TP3 Overview Preview Review Part II
  • Azure Stack Technical Preview (get the bits aka software download here)
  • Azure Stack deployment prerequisites (Microsoft)
  • Microsoft Azure Stack troubleshooting (Microsoft Docs)
  • Azure Stack TP3 refresh tips (Azure Stack)
  • Here is a good post with a tip about not applying certain Windows updates to Azure stack TP3 installs.
  • Configure Azure stack TP3 to be available on your own network (Azure Stack)
  • Azure Stack TP3 Marketplace syndication (Azure Stack)
  • Azure Stack TP3 deployment experiences (Azure Stack)
  • Frequently asked questions for Azure Stack (Microsoft)
  • Deploy Azure Stack (Microsoft)
  • Connect to Azure Stack (Microsoft)
  • Azure Active Directory (AAD) and Active Directory Federation Services (ADFS)
  • Azure Stack TP2 deployment experiences by Niklas Akerlund (@vNiklas) useful for tips for TP3
  • Deployment Checker for Azure Stack Technical Preview (Microsoft Technet)
  • Azure stack and other tools (Github)
  • How to enable nested virtualization on Hyper-V Windows Server 2016
  • Dell EMC announce Microsoft Hybrid Cloud Azure Stack (Dell EMC)
  • Dell EMC Cloud for Microsoft Azure Stack (Dell EMC)
  • Dell EMC Cloud for Microsoft Azure Stack Data Sheet (Dell EMC PDF)
  • Dell EMC Cloud Chats (Dell EMC Blog)
  • Microsoft Azure stack forum
  • Dell EMC Microsoft Azure Stack solution
  • Gaining Server Storage I/O Insight into Microsoft Windows Server 2016
  • Overview Review of Microsoft ReFS (Reliable File System) and resource links
  • Via WServerNews.com Cloud (Microsoft Azure) storage considerations
  • Via CloudComputingAdmin.com Cloud Storage Decision Making: Using Microsoft Azure for cloud storage
  • www.thenvmeplace.com, www.thessdplace.com, www.objectstoragecenter.com and www.storageio.com/converge
  • What this all means

    A common question is if there is demand for private and hybrid cloud, in fact, some industry expert pundits have even said private, or hybrid are dead which is interesting, how can something be dead if it is just getting started. Likewise, it is early to tell if Azure Stack will gain traction with various organizations, some of whom may have tried or struggled with OpenStack among others.

    Given a large number of Microsoft Windows-based servers on VMware, OpenStack, Public cloud services as well as other platforms, along with continued growing popularity of Azure, having a solution such as Azure Stack provides an attractive option for many environments. That leads to the question of if Azure Stack is essentially a replacement for Windows Servers or Hyper-V and if only for Windows guest operating systems. At this point indeed, Windows would be an attractive and comfortable option, however, given a large number of Linux-based guests running on Hyper-V as well as Azure Public, those are also primary candidates as are containers and other services.

    Continue reading more in part two of this two-part series here including installing Microsoft Azure Stack TP3.

    Ok, nuff said (for now…).

    Cheers
    Gs

    Greg Schulz – Microsoft MVP Cloud and Data Center Management, VMware vExpert (and vSAN). Author Cloud and Virtual Data Storage Networking (CRC Press), The Green and Virtual Data Center (CRC Press), Resilient Storage Networks (Elsevier) and twitter @storageio. Watch for the spring 2017 release of his new book "Software-Defined Data Infrastructure Essentials" (CRC Press).

    Courteous comments are welcome for consideration. First published on https://storageioblog.com any reproduction in whole, in part, with changes to content, without source attribution under title or without permission is forbidden.

    All Comments, (C) and (TM) belong to their owners/posters, Other content (C) Copyright 2006-2023 Server StorageIO(R) and UnlimitedIO. All Rights Reserved.

    Azure Stack TP3 Overview Preview Review Part II

    server storage I/O trends

    Azure Stack TP3 Overview Preview (Part II) Install Review

    This is part two of a two-part series looking at Microsoft Azure Stack with a focus on my experiences installing Microsoft Azure Stack Technical Preview 3 (TP3) including into a nested VMware vSphere ESXi environment. Read part one here that provides a general overview of Azure Stack.

    Azure Stack Review and Install

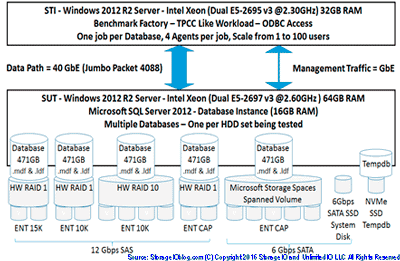
    Being familiar with Microsoft Azure public cloud having used it for a few years now, I wanted to gain some closer insight, experience, expand my trade craft on Azure Stack by installing TP3. This is similar to what I have done in the past with OpenStack, Hadoop, Ceph, VMware, Hyper-V and many others, some of which I need to get around to writing about sometime. As a refresher from part one of this series, the following is an image via Microsoft showing the Azure Stack TP3 architecture, click here or on the image to learn more including the names and functions of the various virtual machines (VMs) that make up Azure Stack.

    Microsoft Azure Stack architecture
    Click here or on the above image to view list of VMs and other services (Image via Microsoft.com)

    Whats Involved Installing Azure Stack TP3?

    The basic steps are as follows:

    • Read this Azure Stack blog post (Azure Stack)
    • Download the bits (e.g. the Azure Stack software) from here, where you access the Azure Stack Downloader tool.
    • Planning your deployment making decisions on Active Directory and other items.
    • Prepare the target server (physical machine aka PM, or virtual machine VM) that will be the Azure Stack destination.
    • Copy Azure Stack software and installer to target server and run pre-install scripts.
    • Modify PowerShell script file if using a VM instead of a PM
    • Run the Azure Stack CloudBuilder setup, configure unattend.xml if needed or answer prompts.
    • Server reboots, select Azure Stack from two boot options.
    • Prepare your Azure Stack base system (time, network NICs in static or DHCP, if running on VMware install VMtools)
    • Determine if you will be running with Azure Active Directory (AAD) or standalone Active Directory Federated Services (ADFS).
    • Update any applicable installation scripts (see notes that follow)
    • Deploy the script, then extended Azure Stack TP3 PoC as needed

    Note that this is a large download of about 16GB (23GB with optional WIndows Server 2016 demo ISO).

    Use the AzureStackDownloader tool to download the bits (about 16GB or 23GB with optional Windows Server 2016 base image) which will either be in several separate files which you stitch back together with the MicrosoftAzureStackPOC tool, or as a large VHDX file and smaller 6.8GB ISO (Windows Server 2016). Prepare your target server system for installation once you have all the software pieces downloaded (or do the preparations while waiting for download).

    Once you have the software downloaded, if it is a series of eight .bin files (7 about 2GB, 1 around 1.5GB), good idea to verify their checksums, then stitch them together on your target system, or on a staging storage device or file share. Note that for the actual deployment first phase, the large resulting cloudbuilder.vhdx file will need to reside in the C:\ root location of the server where you are installing Azure Stack.

    server storageio nested azure stack tp3 vmware

    Azure Stack deployment prerequisites (Microsoft) include:

    • At least 12 cores (or more), dual socket processor if possible
    • As much DRAM as possible (I used 100GB)
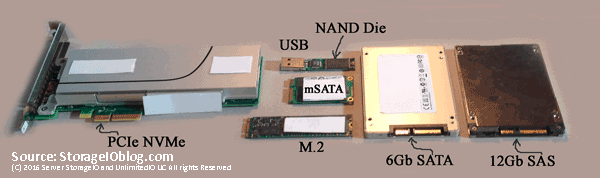
    • Put the operating system disk on flash SSD (SAS, SATA, NVMe) if possible, allocate at least 200GB (more is better)
    • Four x 140GB or larger (I went with 250GB) drives (HDD or SSD) for data deployment drives
    • A single NIC or adapter (I put mine into static instead of DHCP mode)
    • Verify your physical or virtual server BIOS has VT enabled

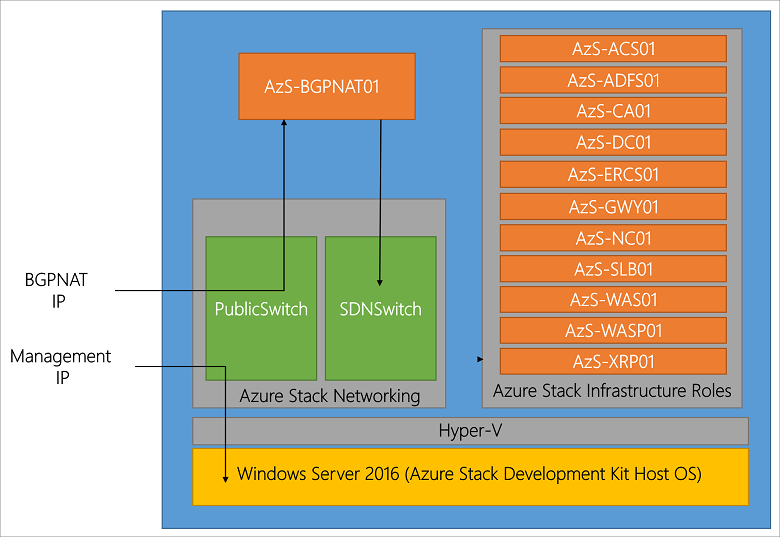
    The above image helps to set the story of what is being done. On the left is for bare metal (BM) or physical machine (PM) install of Azure Stack TP3, on the right, a nested VMware (vSphere ESXi 6.5) with virtual machine (VM) 11 approach. Note that you could also do a Hyper-V nested among other approaches. Shown in the image above common to both a BM or VM is a staging area (could be space on your system drive) where Azure Stack download occurs. If you use a separate staging area, then simply copy the individual .bin files and stitch together into the larger .VHDX, or, copy the larger .VHDX, which is better is up to your preferences.

    Note that if you use the nested approach, there are a couple of configuration (PowerShell) scripts that need to be updated. These changes are to trick the installer into thinking that it is on a PM when it checks to see if on physical or virtual environments.

    Also note that if using nested, make sure you have your VMware vSphere ESXi host along with specific VM properly configured (e.g. that virtualization and other features are presented to the VM). With vSphere ESXi 6.5 virtual machine type 11 nesting is night and day easier vs. earlier generations.

    Something else to explain here is that you will initially start the Azure Stack install preparation using a standard Windows Server (I used a 2016 version) where the .VHDX is copied into its C:\ root. From there you will execute some PowerShell scripts to setup some configuration files, one of which needs to be modified for nesting.

    Once those prep steps are done, there is a Cloudbuilder deploy script that gets run that can be done with an unattend.xml file or manual input. This step will cause a dual-boot option to be added to your server where you can select Azure Stack or your base prep Windows Server instance, followed by reboot.

    After the reboot occurs and you choose to boot into Azure Stack, this is the server instance that will actually run the deployment script, as well as build and launch all the VMs for the Azure Stack TP3 PoC. This is where I recommend having a rough sketch like above to annotate layers as you go to remember what layer working at. Don’t worry, it becomes much easier once all is said and done.

    Speaking of preparing your server, refer to Microsoft specs, however in general give the server as much RAM and cores as possible. Also if possible place the system disk on a flash SSD (SAS, SATA, NVMe) and make sure that it has at least 200GB, however 250 or even 300GB is better (just in case you need more space).

    Additional configuration tips include allocating four data disks for Azure, if possible make these SSDs as well as, however more important IMHO to have at least the system on fast flash SSD. Another tip is to enable only one network card or NIC and put it into static vs. DHCP address mode to make things easier later.

    Tip: If running nested, vSphere 6.5 worked the smoothest as had various issues or inconsistencies with earlier VMware versions, even with VMs that ran nested just fine.

    Tip: Why run nested? Simple, I wanted to be able to use using VMware tools, do snapshots to go back in time, plus share the server with some other activities until ready to give Azure Stack TP3 its own PM.

    Tip: Do not connect the POC machine to the following subnets (192.168.200.0/24, 192.168.100.0/27, 192.168.101.0/26, 192.168.102.0/24, 192.168.103.0/25, 192.168.104.0/25) as Azure Stack TP3 uses those.

    storageio azure stack tp3 vmware configuration

    Since I decided to use a nested VM deploying using VMware, there were a few extra steps needed that I have included as tips and notes. Following is view via vSphere client of the ESXi host and VM configuration.

    The following image combines a couple of different things including:

    A: Showing the contents of C:\Azurestack_Supportfiles directory

    B: Modifying the PrepareBootFromVHD.ps1 file if deploying on virtual machine (See tips and notes)

    C: Showing contents of staging area including individual .bin files along with large CloudBuilder.vhdx

    D: Running the PowerShell script commands to prepare the PrepareBootFromVHD.ps1 and related items

    prepariing azure stack tp3 cloudbuilder for nested vmware deployment

    From PowerShell (administrator):

    # Variables
    $Uri = 'https://raw.githubusercontent.com/Azure/Azure stack/master/Deployment/'
    $LocalPath = 'c:\AzureStack_SupportFiles'

    # Create folder
    New-Item $LocalPath -type directory

    # Download files
    ( 'BootMenuNoKVM.ps1', 'PrepareBootFromVHD.ps1', 'Unattend.xml', 'unattend_NoKVM.xml') | foreach { Invoke-WebRequest ($uri + $_) -OutFile ($LocalPath + '\' + $_) }

    After you do the above, decide if you will be using an Unattend.xml or manual entry of items for building the Azure Stack deployment server (e.g. a Windows Server). Note that the above PowerShell script created the C:\azurestack_supportfiles folder and downloads the script files for building the cloud image using the previously downloaded Azure Stack CloudBuilder.vhdx (which should be in C:\).

    Note and tip is that if you are doing a VMware or virtual machine based deployment of TP3 PoC, you will need to change C:\PrepareBootFromVHD.ps1 in the Azure Stack support files folder. Here is a good resource on what gets changed via Github that shows an edit on or about line 87 of PrepareBootFromVHD.ps1. If you run the PrepareBootFromVHD.ps1 script on a virtual machine you will get an error message, the fix is relatively easy (after I found this post).

    Look in PrepareBootFromVHD.ps1 for something like the following around line 87:

    if ((get-disk | where {$_.isboot -eq $true}).Model -match 'Virtual Disk')       {      Write-Host "The server is currently already booted from a virtual hard disk, to boot the server from the CloudBuilder.vhdx you will need to run this script on an Operating System that is installed on the physical disk of this server."      Exit      }
    

    You can either remove the "exit" command, or, change the test for "Virtual Disk" to something like "X", for fun I did both (and it worked).

    Note that you only have to make the above and another change in a later step if you are deploying Azure Stack TP3 as a virtual machine.

    Once you are ready, go ahead and launch the PrepareBootFromVHD.ps1 script which will set the BCDBoot entry (more info here).

    azure stack tp3 cloudbuilder nested vmware deployment

    You will see a reboot and install, this is installing what will be called the physical instance. Note that this is really being installed on the VM system drive as a secondary boot option (e.g. azure stack).

    azure stack tp3 dual boot option

    After the reboot, login to the new Azure Stack base system and complete any configuration including adding VMware Tools if using VMware nested. Some other things to do include make sure you have your single network adapter set to static (makes things easier), and any other updates or customizations. Before you run the next steps, you need to decide if going to use Azure Active Directory (AAD) or local ADFS.

    Note that if you are not running on a virtual machine, simply open a PowerShell (administrator) session, and run the deploy script. Refer to here for more guidance on the various options available including discussion on using AAD or ADFS.

    Note if you run the deployment script on a virtual machine, you will get an error which is addressed in the next section, otherwise, sit back and watch the progress..

    CloudBuilder Deployment Time

    Once you have your Azure Stack deployment system and environment ready, including a snapshot if on virtual machine, launch the PowerShell deployment script. Note that you will need to have decided if deploying with Azure Active Directory (AAD) or Azure Directory Federated Services (ADFS) for standalone aka submarine mode. There are also other options you can select as part of the deployment discussed in the Azure Stack tips here (a must read) and here. I chose to do a submarine mode (e.g. not connected to Public Azure and AAD) deployment.

    From PowerShell (administrator):

    cd C:\CloudDeployment:\Setup
    $adminpass = ConvertTo-SecureString "youradminpass" -AsPlainText -Force
    .\InstallAzureStackPOC.ps1 -AdminPassword $adminpass -UseADFS

    Deploying on VMware Virtual Machines Tips

    Here is a good tip via Gareth Jones (@garethjones294) that I found useful for updating one of the deployment script files (BareMetal_Tests.ps1 located in C:\CloudDeployment\Roles\PhysicalMachines\Tests folder) so that it would skip the bare metal (PM) vs. VM tests. Another good resource, even though it is for TP2 and early versions of VMware is TP2 deployment experiences by Niklas Akerlund (@vNiklas).

    Note that this is a bit of a chick and egg scenario unless you are proficient at digging into script files since the BareMetal_Tests.ps1 file does not get unpacked until you run the CloudBuilder deployment script. If you run the script and get an error, then make the changes below, and rerun the script as noted. Once you make the modification to the BareMetal_Tests.ps1 file, keep a copy in a safe place for future use.

    Here are some more tips for deploying Azure Stack on VMware,

    Per the tip mentioned about via Gareth Jones (tip: read Gareths post vs. simply cut and paste the following which is more of a guide):

    Open BareMetal_Tests.ps1 file in PowerShell ISE and navigate to line 376 (or in that area)
    Change $false to $true which will stop the script failing when checking to see if the Azure Stack is running inside a VM.
    Next go to line 453.
    Change the last part of the line to read “Should Not BeLessThan 0”
    This will stop the script checking for the required amount of cores available.

    After you make the above correction as with any error (and fix) during Azure Stack TP3 PoC deployment, simply run the following.

    cd C:\CloudDeployment\Setup
    .\InstallAzureStackPOC.ps1 -rerun
    

    Refer to the extra links in the where to learn more section below that offer various tips, tricks and insight that I found useful, particular for deploying on VMware aka nested. Also in the links below are tips on general Azure Stack, TP2, TP3, adding services among other insight.

    starting azure stack tp3 deployment

    Tip: If you are deploying Azure Stack TP3 PoC on virtual machine, once you start the script above, copy the modified BareMetal_Tests.ps1 file

    Once the CloudBuilder deployment starts, sit back and wait, if you are using SSDs, it will take a while, if using HDDs, it will take a long while (up to hours), however check in on it now and then to see progress of if any errors. Note that some of the common errors will occur very early in the deployment such as the BareMetal_Tests.ps1 mentioned above.

    azure stack tp3 deployment finished

    Checking in periodically to see how the deployment progress is progressing, as well as what is occurring. If you have the time, watch some of the scripts as you can see some interesting things such as the software defined data center (SDDC) aka software-defined data infrastructure (SDDC) aka Azure Stack virtual environment created. This includes virtual machine creation and population, creating the software defined storage using storage spaces direct (S2D), virtual network and active directory along with domain controllers among others activity.

    azure stack tp3 deployment progress

    After Azure Stack Deployment Completes

    After you see the deployment completed, you can try accessing the management portal, however there may be some background processing still running. Here is a good tip post on connecting to Azure Stack from Microsoft using Remote Desktop (RDP) access. Use RDP from the Azure Stack deployment Windows Server and connect to a virtual machine named MAS-CON01, launch Server Manager and for Local Server disable Internet Explorer Enhanced Security (make sure you are on the right system, see the tip mentioned above). Disconnect from MAS-CON01 (refer to the Azure Stack architecture image above), then reconnect, and launch Internet Explorer with an URL of (note documentation side to use which did not work for me).

    Note the username for the Azure Stack system is AzureStack\AzureStackAdmin with a password of what you set for administrative during setup. If you get an error, verify the URLs, check your network connectivity, wait a few minutes as well as verify what server you are trying to connect from and too. Keep in mind that even if deploying on a PM or BM (e.g. non virtual server or VM), the Azure Stack deployment TP3 PoC creates a "virtual" software-defined environment with servers, storage (Azure Stack uses Storage Spaces Direct [S2D] and software defined network.

    accessing azure stack tp3 management portal dashboard

    Once able to connect to Azure Stack, you can add new services including virtual machine image instances such as Windows (use the Server 2016 ISO that is part of Azure Stack downloads), Linux or others. You can also go to these Microsoft resources for some first learning scenarios, using the management portals, configuring PowerShell and troubleshooting.

    Where to learn more

    The following provide more information and insight about Azure, Azure Stack, Microsoft and Windows among related topics.

  • Azure Stack Technical Preview 3 (TP3) Overview Preview Review
  • Azure Stack TP3 Overview Preview Review Part II
  • Azure Stack Technical Preview (get the bits aka software download here)
  • Azure Stack deployment prerequisites (Microsoft)
  • Microsoft Azure Stack troubleshooting (Microsoft Docs)
  • Azure Stack TP3 refresh tips (Azure Stack)
  • Here is a good post with a tip about not applying certain Windows updates to AzureStack TP3 installs.
  • Configure Azure Stack TP3 to be available on your own network (Azure Stack)
  • Azure Stack TP3 Marketplace syndication (Azure Stack)
  • Azure Stack TP3 deployment experiences (Azure Stack)
  • Frequently asked questions for Azure Stack (Microsoft)
  • Azure Active Directory (AAD) and Active Directory Federation Services (ADFS)
  • Deploy Azure Stack (Microsoft)
  • Connect to Azure Stack (Microsoft)
  • Azure Stack TP2 deployment experiences by Niklas Akerlund (@vNiklas) useful for tips for TP3
  • Deployment Checker for Azure Stack Technical Preview (Microsoft Technet)
  • Azure stack and other tools (Github)
  • How to enable nested virtualization on Hyper-V Windows Server 2016
  • Dell EMC announce Microsoft Hybrid Cloud Azure Stack (Dell EMC)
  • Dell EMC Cloud for Microsoft Azure Stack (Dell EMC)
  • Dell EMC Cloud for Microsoft Azure Stack Data Sheet (Dell EMC PDF)
  • Dell EMC Cloud Chats (Dell EMC Blog)
  • Microsoft Azure stack forum
  • Dell EMC Microsoft Azure Stack solution
  • Gaining Server Storage I/O Insight into Microsoft Windows Server 2016
  • Overview Review of Microsoft ReFS (Reliable File System) and resource links
  • Via WServerNews.com Cloud (Microsoft Azure) storage considerations
  • Via CloudComputingAdmin.com Cloud Storage Decision Making: Using Microsoft Azure for cloud storage
  • www.thenvmeplace.com, www.thessdplace.com, www.objectstoragecenter.com and www.storageio.com/converge
  • What this all means

    A common question is if there is demand for private and hybrid cloud, in fact, some industry expert pundits have even said private, or hybrid are dead which is interesting, how can something be dead if it is just getting started. Likewise, it is early to tell if Azure Stack will gain traction with various organizations, some of whom may have tried or struggled with OpenStack among others.

    Given a large number of Microsoft Windows-based servers on VMware, OpenStack, Public cloud services as well as other platforms, along with continued growing popularity of Azure, having a solution such as Azure Stack provides an attractive option for many environments. That leads to the question of if Azure Stack is essentially a replacement for Windows Servers or Hyper-V and if only for Windows guest operating systems. At this point indeed, Windows would be an attractive and comfortable option, however, given a large number of Linux-based guests running on Hyper-V as well as Azure Public, those are also primary candidates as are containers and other services.

    software defined data infrastructures SDDI and SDDC

    Some will say that if OpenStack is struggling in many organizations and being free open source, how Microsoft can have success with Azure Stack. The answer could be that some organizations have struggled with OpenStack while others have not due to lack of commercial services and turnkey support. Having installed both OpenStack and Azure Stack (as well as VMware among others), Azure Stack is at least the TP3 PoC is easy to install, granted it is limited to one node, unlike the production versions. Likewise, there are easy to use appliance versions of OpenStack that are limited in scale, as well as more involved installs that unlock full functionality.

    OpenStack, Azure Stack, VMware and others have their places, alongside, or supporting containers along with other tools. In some cases, those technologies may exist in the same environment supporting different workloads, as well as accessing various public clouds, after all, Hybrid is the home run for many if not most legality IT environments.

    Ok, nuff said (for now…).

    Cheers
    Gs

    Greg Schulz – Microsoft MVP Cloud and Data Center Management, VMware vExpert (and vSAN). Author Cloud and Virtual Data Storage Networking (CRC Press), The Green and Virtual Data Center (CRC Press), Resilient Storage Networks (Elsevier) and twitter @storageio. Watch for the spring 2017 release of his new book "Software-Defined Data Infrastructure Essentials" (CRC Press).

    Courteous comments are welcome for consideration. First published on https://storageioblog.com any reproduction in whole, in part, with changes to content, without source attribution under title or without permission is forbidden.

    All Comments, (C) and (TM) belong to their owners/posters, Other content (C) Copyright 2006-2023 Server StorageIO(R) and UnlimitedIO. All Rights Reserved.

    Some popular 2016 storageioblog posts

    Some popular 2016 storageioblog posts

    server storage I/O trends

    Big Files and Lots of Little File Processing and Benchmarking with Vdbench – Need to test, validate, compare, contrast or simply apply workload to file systems, NAS or other file-based access? Want the flexibility and simplicity to software define your benchmark workload to meet various needs? For example, millions of small files or thousands of large 5GB, 10GB, 15GB (or larger) files with various read, write size and access patterns spanning a single directory, or many with various depths? Do you want the flexibility for different platforms including Windows, *NIX, bare metal, container, virtual or cloud without a bulk tool using simple scripts that produce lots of insightful results? Then you will want to check this post out.

    Breaking the VMware ESXi 5.5 ACPI boot loop on Lenovo TD350 – Ever have a VMware host server go into a boot loop and purple screen of death (PSD) then displaying a message about ACPI or similar? After spending time searching and applying many filters to sift through the noise of false positive matches, finally found the simple fix (e.g. a BIOS setting) to break the VMware ESXi vSphere boot loop, or at least on a Lenovo server.

    Cloud and Object Storage

    Cloud conversations: AWS EBS, Glacier and S3 overview (Part I) – This is one of the perennial favorites that while new features have been added with others extended, the post series still provides a good overview, primer or refresher of various Amazon Web Services (AWS) services including how they work. Interesting in learning more about Microsoft and Azure, then check out this, this, this and this.

    Cloud Conversations: AWS EFS Elastic File System (Cloud NAS) – This is a companion to the above AWS as well as other cloud post series that looks at AWS Elastic File System. Note that other cloud service providers have also added NAS file access support, some are intra (e.g. inside AWS cloud), others are inter-cloud (e.g. inside and outside cloud) such as Azure (can work with external Windows Servers using SMB3). Even OpenStack has added NAS file with Manila folders and Ceph with CephFS among others. So when some people tell you that NAS and file access are dead particular for cloud, remind them of the increasing number of services and software stacks that are adding new services to allow their solution to be compatible with existing environments or applications.

    Server Storage I/O performance

    Collecting Transaction Per Minute from SQL Server and HammerDB – If you have used the free tool HammerDB (e.g. Hammora) for driving database workloads, simulations or benchmarks you should recall that the resulting statistics are rather lacking. Sure there is a nice GUI chart that shows current executing transactions per second (TPS) along with some very simple counters in the log. However compared to some other tools such as sysbench, Quest Benchmark Factory and YCSB among others, the Hammer metrics are rather lacking. In this post I show how you can collect some more metrics from SQL Server if you have to use HammerDB. View more server storage I/O performance benchmark and monitoring tools resources here.

    Windows Server 2016

    Gaining Server Storage I/O Insight into Microsoft Windows Server 2016 – Microsoft released into general availability Windows Server 2016 and this post looks at some of the new features along with functionality including Storage Spaces Direct (S2D), Storage Replica (SR) as well as other enhancements. With these new and enhanced features Windows Servers increase their interoperability with Azure, as well as supporting aggregated hyper-converged infrastructure (HCI), disaggregated converged (CI) as well as traditional workloads along with Hyper-V (and containers). One of the other new enhancements in Windows Server 2016 which now uses ReFS (Reliable File System) as its default file system that you can read more about here. RIP Windows SIS (Single Instance Storage), or at least in Server 2016 With Windows Server 2016 Microsoft removed single instance storage replacing with new capabilities that you can read more about in the this post.

    Garbage data in garbage data out

    Garbage data in, garbage information out, big data or big garbage? There is a classic IT expression of garbage data in results in garbage data (or information out) in that your algorithms and data structures (which equals programs e.g. Niklaus Wirth) are only as good as the data they work on. What this means then is that if there is a large amount of big data then there can also be a big garbage in and garbage out problem unless addressed.

    Hard product vs. soft product – Hard product refers to something such as hardware, software or a service resource that is obtained and then joined with other resources in a particular way to create a soft product. Not to be confused with software, the soft product is the result or how resources get defined that give some ability or benefit. Think of a soft product as for how airlines can use the same airplane, serve the same coca cola, have same seats, yet their soft product is the service experience of how those are delivered, as well as how you find and buy or use them. Another way of thinking about it is hard products are the ingredients for a recipe, the recipe defines how those ingredients result in some food dish.

    how many IOPs can an HDD or SSD do

    Part II: How many IOPS can a HDD, HHDD or SSD do with VMware? – This is part of a multi-post series looking at how many IOPs (or bandwidth) various HDD and SSDs can do handling different workloads. Of course, your results will vary with configuration settings, tools among other considerations. However, some of the older rules of thumb (RUT) about RPM and other considerations for HDDs have changed and continue to do so. As an example of how HDDs continue to evolve check out this popular post from the 2016 list Which Enterprise HDDs to use for a Content Server Platform.

    Part II: What I did with Lenovo TS140 in my Server and Storage I/O Review – This is a popular post series of some things I have done with a Lenovo TS140 including defining with various software as well as hardware. This is a great price performer value system that several years ago after testing one Lenovo sent me, I returned that to Lenovo and bought several of them to join my other systems.

    Server and Storage I/O Benchmarking and Performance Resources – This is a collection of various server, storage I/O and networking hardware, software as well as services tools, techniques as well as tips for benchmarking, comparing, simulation, testing, gaining insight across cloud, virtual, container and legacy resources. Server and Storage I/O Benchmark Tools: Microsoft Diskspd (Part I) – This is one of the tools found on the server, storage I/O benchmarking and performance resources page. Diskspd is a tool developed by Microsoft as an alternative to using Iometer, vdbench, fio.exe, SQLIO among many others, plus, it is on github.

    server storage I/O nvme and ssd

    The NVM (Non Volatile Memory) and NVMe Place – Interesting and adoption in nand flash, nvram, 3D XPoint among other SSD and Non-volatile Memory (NVM) continues. Another popular post that you can find at thenvmeplace.com is this NVMe overview and primer – Part I. There is a growing interest, awareness and deployment adoption around NVM Express (NVMe) the new protocol for accessing NVMs and SSDs. Some of the common conversations and questions I encounter is confusion between NVM and NVMe, too which the answer is one (the former) are the media or devices, the other is the access method alternative to using AHCI/SATA or SCSI (e.g. SAS, iSCSI, FCP, SRP) among others.

    VMware VVOLs and storage I/O fundamentals (Part 1) – VMware Virtual Volumes (VVOL) continue to gain adoption and this post is part of an overview and primer. If you want to go deeper into VVOL as well as see some adoption insights check out Eric Sieberts post here over at vsphere-land.com

    Welcome to the Object Storage Center page – This is a micro site that has a primer and overview of cloud as well as object storage along with an expanding list of links to various resources, tips, technologies, tools, trends and industry activity.

    Where To Learn More

    www.storageio.com particular if you have not been there for awhile to check out the new streamlined look and navigation to various content including Server StorageIO update newsletters (free subscription) among other resources.

    Additional learning experiences along with common questions (and answers), as well as tips can be found in Software Defined Data Infrastructure Essentials book.

    Software Defined Data Infrastructure Essentials Book SDDC

    What this all means and wrapping up

    Some of the popular posts for 2016 are perennial favorites and based on experience will probably appear on the 2017 list. However there are also several new posts that appeared in 2016 that I suspect will also appear on the 2017 version of the above list, along with new content from 2017.

    Thank you to all of you who frequent StorageIOblog.com as well as StorageIO.com along with our various micro sites including server storage I/O performance and benchmarking resources, thenvmeplace.com, thessdplace.com, cloud and objectstoragecenter.com, data protection diaries among others.

    Also thank you for viewing various partner venues and syndicates with extra ones appearing throughout 2017. Watch for more content in the coming weeks, months and throughout 2017 on software defined data infrastructures (SDDI) along with server, storage I/O, networking, hardware, software, cloud, container, data protection and related topics, trends, technologies, tools and tips.

    Again, thank you

    Ok, nuff said, for now.

    Gs

    Greg Schulz – Microsoft MVP Cloud and Data Center Management, VMware vExpert 2010-2017 (vSAN and vCloud). Author of Software Defined Data Infrastructure Essentials (CRC Press), as well as Cloud and Virtual Data Storage Networking (CRC Press), The Green and Virtual Data Center (CRC Press), Resilient Storage Networks (Elsevier) and twitter @storageio. Courteous comments are welcome for consideration. First published on https://storageioblog.com any reproduction in whole, in part, with changes to content, without source attribution under title or without permission is forbidden.

    All Comments, (C) and (TM) belong to their owners/posters, Other content (C) Copyright 2006-2024 Server StorageIO and UnlimitedIO. All Rights Reserved. StorageIO is a registered Trade Mark (TM) of Server StorageIO.

    September and October 2016 Server StorageIO Update Newsletter

    Volume 16, Issue IX

    Hello and welcome to this September and October 2016 Server StorageIO update newsletter.

    In This Issue

  • Commentary in the news
  • Tips and Articles
  • StorageIOblog posts
  • Events and Webinars
  • Industry Activity Trends
  • Resources and Links
  • Connect and Converse With Us
  • About Us
  • Enjoy this edition of the Server StorageIO update newsletter.

    Cheers GS

    Industry Activity Trends

    Recent Industry Activates and Trends

    EMC is now Dell EMC – What this means is that EMC is no longer a publicly traded company instead now being privately held under the Dell Technologies umbrella. In case you did not know or had forgotten, one of the principal owners of Dell Technologies is Michael Dell aka the founder of Dell Computers which itself went private a few years ago. Read more in this Server StoageIOblog update post.

    While Michael Dell and Dell Technologies continues to expand by acquiring companies (granted also shedding some assets to support that growth), HP Enterprise (HPE) is taking a different approach. Similar to Dell, HPE has been offloading some of its divisions and assets since its split into two separate companies about a year ago.

    More recently HPE has announced it is selling off some of its software assets to which follows other deals where HPE created a new partnership with CSC to offload or park some of its services assets. What’s not clear is HPE CEO Meg Whitman leveraging the trend that some Private Equity (PE) firms are interested in acquiring under performing companies or assets to prepare them as part of a pivot to profit scenario, or something else?

    • HPE selling off business units including software group here, here, here and here
    • HPE looking to boost its HPC and super compute business with $275B acquisition of SGI
    • Announced new shared storage for SMB and mid-size environments including for sub $10K price points. These include HPE StoreVirtual 3200 and HPE MSA 2042.
    • HPE and Dropbox partnership
    • Various other HPE news and updates

    Hyper-Converged Infrastructure (HCI) startup vendor Nutanix finally IPO (NTNX) after a not so consolidated IPO cycle. Prior to the IPO NTNX acquired other startup Pernix (VMware cache software solution) and calmio to beef up their product portfolio. Congratulations to NTNX and best wishes, hopefully the public markets will provide risk vs. reward, on the other hand, now being public, the spotlight will be on them.

    Nutanix Stock via Yahoo 10/31/16
    NTNX Stock Trading via Yahoo Finance 10/31/16 (Click to see current status)


    Microsoft has extended its software defined storage (SDS) along with software defined data center (SDDC) as well as software defined networking (SDN) capabilities by formerly announcing Windows Server 2016. A month or so ago Microsoft announced the 20th birthday or anniversary of Windows Server as well as having previously released Tech Previews (TP).
    See what’s new in Server 2016 here. For those not aware, With Windows Server 2016, you can configure it to be CI, HCI, legacy or various hybrid ways to meet your needs, along with your choice of hardware from your preferred vendor or solution provider. Read more about Microsoft Windows Server 2016 and related topics in this Server StorageIOblog post.

    Needless to say there is a lot of other activity in the works including VMware enhancements with vSphere 6.5 as well as VMware vSphere (and related tools) being announced as hosted on bare metal (BM) dedicated private servers (DPS) via AWS among other updates.


    StorageIOblog Posts

    Recent and popular Server StorageIOblog posts include:

    View other recent as well as past StorageIOblog posts here


    StorageIO Commentary in the news

    Recent Server StorageIO industry trends perspectives commentary in the news.

    Via InfoStor Top Ten Data Storage Performance Tips: Improving Data Storage
    Via ChannelProNetwork Your Time Will Come, All-Flash Storage
    Via FutureReadyOEM When to implement ultra-dense CI or HCI storage
    Via EnterpriseStorageForum Top 10 Enterprise SSD Market Trends
    Via EnterpriseStorageForum Storage Hyperconvergence: When Does It Make Sense?
    SearchCloudStorage: EMC VxRack Neutrino Nodes launched for OpenStack cloud storage
    EnterpriseStorageForum: Looking Beyond the Hype at Hyperconvergence in Storage
    CDW Digital: Transitioning Data Centers To Hybrid Environment
    SearchDataCenter: EMC, VCE, CI and Hyperconverged vs. Hyper-small
    InfoStor: Docker and Containerization Storage Buying Guide
    NetworkComputing: Dell-EMC: The Storage Ramifications
    EnterpriseTech: VMware Targets Synergies in Dell-EMC Deal 
    HPCwire: Dell to Buy EMC Focus on Large Enterprises and High-End Computing
    EnterpriseStorageForum: Storage Futures: Do We Really Need to Store Everything?

    View more Server, Storage and I/O hardware as well as software trends comments here


    StorageIO Tips and Articles

    Recent and past Server StorageIO articles appearing in different venues include:

    Via Iron Mountain  Is Your Data Infrastructure Prepared for Storm Season?
    Via Iron Mountain  Preventing Unexpected Disasters: IT and Data Infrastructure
    Via FutureReadyOEM  When to implement ultra-dense storage
    Via Micron Blog (Guest Post)  Whats next for NVMe and your Data Center
    Redmond Magazine  Data Protection Trends – Evolving Data Protection and Resiliency
    Virtual Blocks (VMware Blogs)  EVO:RAIL Part III – When And Where To Use It?
    Virtual Blocks (VMware Blogs)  EVO:RAIL Part II – Why And When To Use It?
    Virtual Blocks (VMware Blogs)  EVO:RAIL Part I – What Is It And Why Does It Matter?

    Check out these resources techniques, trends as well as tools. View more tips and articles here


    Events and Activities

    Recent and upcoming event activities.

    December 7, 2016 11AM PT – BrightTalk Webinar: Hyper-Converged Infrastructure

    November 29-30, 2016 – Nijkerk Netherlands Workshop Seminar (Presenting)
    Organized by Brouwer Storage Consultancy

    Converged and Other Server Storage Decision Making

    November 28, 2016 – Nijkerk Netherlands Workshop Seminar (Presenting)
    Organized by Brouwer Storage Consultancy
    – Industry Trends Update

    November 23, 2016 10AM PT – BrightTalk Webinar: BCDR and Cloud Backup
    Software Defined Data Infrastructures (SDDI) and Data Protection

    November 23, 2016 9AM PT – BrightTalk Webinar: Cloud Storage
    Hybrid and Software Defined Data Infrastructures (SDDI)

    November 22, 2016 10AM PT – BrightTalk Webinar: Cloud Infrastructure
    Hybrid and Software Defined Data Infrastructures (SDDI)

    November 15, 2016 11AM PT – Redmond Magazine and SolarWinds
    Presenting – The O.A.R. of Virtualization Scaling

    November 3, 2016 11AM PT – Redmond Magazine and Dell Software
    Presenting – Backup, Data Protection and Security Management

    October 27, 2016 10AM PT – Virtual Instruments Webinar
    The Value of Infrastructure Insight

    October 20, 2016 9AM PT – BrightTalk Webinar: Next-Gen Data Centers
    Software Defined Data Infrastructures (SDDI) – Servers, Storage and Virtualization

    September 20, 2016 8AM PT – BrightTalk Webinar
    Software Defined Data Infrastructures (SDDI)
    Enabling Software Defined Data Centers

    September 13, 2016 11AM PT – Redmond Magazine and Dell Software
    Windows Server 2016 and Active Directory
    What’s New and How to Plan for Migration

    See more webinars and other activities on the Server StorageIO Events page here.


    Server StorageIO Industry Resources and Links

    Useful links and pages:
    Microsoft TechNet – Various Microsoft related from Azure to Docker to Windows
    storageio.com/links – Various industry links (over 1,000 with more to be added soon)
    objectstoragecenter.com – Cloud and object storage topics, tips and news items
    OpenStack.org – Various OpenStack related items
    storageio.com/protect – Various data protection items and topics
    thenvmeplace.com – Focus on NVMe trends and technologies
    thessdplace.com – NVM and Solid State Disk topics, tips and techniques
    storageio.com/performance – Various server, storage and I/O performance and benchmarking
    VMware Technical Network – Various VMware related items

    Ok, nuff said, for now…

    Cheers
    Gs

    Greg Schulz – Microsoft MVP Cloud and Data Center Management, vSAN and VMware vExpert. Author Cloud and Virtual Data Storage Networking (CRC Press), The Green and Virtual Data Center (CRC Press) and Resilient Storage Networks (Elsevier) and twitter @storageio

    All Comments, (C) and (TM) belong to their owners/posters, Other content (C) Copyright 2006-2023 Server StorageIO(R) and UnlimitedIO All Rights Reserved

    Gaining Server Storage I/O Insight into Microsoft Windows Server 2016

    Server Storage I/O Insight into Microsoft Windows Server 2016

    server storage I/O trends
    Updated 12/8/16

    In case you had not heard, Microsoft announced the general availability (GA, also known as Release To Manufacturing (RTM) ) of the newest version of its Windows server operating system aka Windows Server 2016 along with System Center 2016. Note that as well as being released to traditional manufacturing distribution mediums as well as MSDN, the Windows Server 2016 bits are also available on Azure.

    Microsoft Windows Server 2016
    Windows Server 2016 Welcome Screen – Source Server StorageIOlab.com

    For some this might be new news, or a refresh of what Microsoft announced a few weeks ago (e.g. the formal announcement). Likewise, some of you may not be aware that Microsoft is celebrating WIndows Server 20th Birthday (read more here).

    Yet for others who have participated in the public beta aka public technical previews (TP) over the past year or two or simply after the information coming out of Microsoft and other venues, there should not be a lot of surprises.

    Whats New With Windows Server 2016

    Microsoft Windows Server 2016 Desktop
    Windows Server 2016 Desktop and tools – Source Server StorageIOlab.com

    Besides a new user interface including visual GUI and Powershell among others, there are many new feature functionalities summarized below:

    • Enhanced time-server with 1ms accuracy
    • Nano and Windows Containers (Linux via Hyper-V)
    • Hyper-V enhanced Linux services including shielded VMs
    • Simplified management (on-premisess and cloud)
    • Storage Spaces Direct (S2D) and Storage Replica (SR) – view more here and here


    Storage Replica (SR) Scenarios including synchronous and asynchronous – Via Microsoft.com

    • Resilient File System aka ReFS (now default file system) storage tiering (cache)
    • Hot-swap virtual networking device support
    • Reliable Change Tracking (RCT) for faster Hyper-V backups
    • RCT improves resiliency vs. VSS change tracking
    • PowerShell and other management enhancements
    • Including subordinated / delegated management roles
    • Compliment Azure AD with on premise AD
    • Resilient/HA RDS using Azure SQL DB for connection broker
    • Encrypted VMs (at rest and during live migration)
    • AD Federation Services (FS) authenticate users in LDAP dir.
    • vTPM for securing and encrypting Hyper-V VMs
    • AD Certificate Services (CS) increase support for TPM
    • Enhanced TPM support for smart card access management
    • AD Domain Services (DS) security resiliency for hybrid and mobile devices

    Here is a Microsoft TechNet post that goes into more detail of what is new in WIndows Server 2016.

    Free ebook: Introducing Windows Server 2016 Technical Preview (Via Microsoft Press)

    Check out the above free ebook, after looking through it, I recommend adding it to your bookshelf. There are lots of good intro and overview material for Windows Server 2016 to get you up to speed quickly, or as a refresh.

    Storage Spaces Direct (S2D) CI and HCI

    Storage Spaces Direct (S2D) builds on Storage Spaces that appeared in earlier Windows and Windows Server editions. Some of the major changes and enhancements include ability to leverage local direct attached storage (DAS) such as internal (or external) dedicated NVMe, SAS and SATA HDDs as well as flash SSDs that used for creating software defined storage for various scenarios.

    Scenarios include converged infrastructure (CI) disaggregated as well as aggregated hyper-converged infrastructure (HCI) for Hyper-V among other workloads. Windows Server 2016 S2D nodes communicate (from a storage perspective) via a software storage bus. Data Protection and availability is enabled between S2D nodes via Storage Replica (SR) that can do software based synchronous and asynchronous replication.


    Aggregated – Hyper-Converged Infrastructure (HCI) – Source Microsoft.com


    Desegregated – Converged Infrastructure (CI) – Source Microsoft.com

    The following is a Microsoft produced YouTube video providing a nice overview and insight into Windows Server 2016 and Microsoft Software Defined Storage aka S2D.


    YouTube Video Storage Spaces Direct (S2D) via Microsoft.com

    Server storage I/O performance

    What About Performance?

    A common question that comes up with servers, storage, I/O and software defined data infrastructure is what about performance?

    Following are some various links to different workloads showing performance for Hyper-V, S2D and Windows Server. Note as with any benchmark, workload or simulation take them for what they are, something to compare that may or might not be applicable to your own workload and environments.

    • Large scale VM performance with Hyper-V and in-memory transaction processing (Via Technet)
    • Benchmarking Microsoft Hyper-V server, VMware ESXi and Xen Hypervisors (Via cisjournal PDF)
    • Server 2016 Impact on VDI User Experience (Via LoginVSI)
    • Storage IOPS update with Storage Spaces Direct (Via TechNet)
    • SQL Server workload (benchmark) Order Processing Benchmark using In-Memory OLTP (Via Github)
    • Setting up testing Windows Server 2016 and S2D using virtual machines (Via MSDN blogs)
    • Storage throughput with Storage Spaces Direct (S2D TP5 (Via TechNet)
    • Server and Storage I/O Benchmark Tools: Microsoft Diskspd (Part I)

    Where To Learn More

    For those of you not as familiar with Microsoft Windows Server and related topics, or that simply need a refresh, here are several handy links as well as resources.

    • Introducing Windows Server 2016 (Free ebook from Microsoft Press)
    • What’s New in Windows Server 2016 (Via TechNet)
    • Microsoft S2D Software Storage Bus (Via TechNet)
    • Understanding Software Defined Storage with S2D in Windows Server 2016 (Via TechNet)
    • Microsoft Storage Replica (SR) (Via TechNet)
    • Server and Storage I/O Benchmark Tools: Microsoft Diskspd (Part I)
    • Microsoft Windows S2D Software Defined Storage (Via TechNet)
    • Windows Server 2016 and Active Directory (Redmond Magazine Webinar)
    • Data Protection for Modern Microsoft Environments (Redmond Magazine Webinar)
    • Resilient File System aka ReFS (Via TechNet)
    • DISKSPD now on GitHub, and the mysterious VMFLEET released (Via TechNet)
    • Hyper-converged solution using Storage Spaces Direct in Windows Server 2016 (Via TechNet)
    • NVMe, SSD and HDD storage configurations in Storage Spaces Direct TP5 (Via TechNet)
    • General information about SSD at www.thessdplace.com and NVMe at www.thenvmeplace.com
    • How to run nested Hyper-V and Windows Server 2016 (Via Altaro and via MSDN)
    • How to run Nested Windows Server and Hyper-V on VMware vSphere ESXi (Via Nokitel)
    • Get the Windows Server 2016 evaluation bits here
    • Microsoft Azure Stack overview and related material via Microsoft
    • Introducing Windows Server 2016 (Via MicrosoftPress)
    • Various WIndows Server and S2D lab scripts (Via Github)
    • Storage Spaces Direct – Lab Environment Setup (Via Argon Systems)
    • Setting up S2D with a 4 node configuration (Via StarWind blog)
    • SQL Server workload (benchmark) Order Processing Benchmark using In-Memory OLTP (Via Github)
    • Setting up testing Windows Server 2016 and S2D here using virtual machines (Via MSDN blogs)
    • Hyper-V large-scale VM performance for in-memory transaction processing (Via Technet)
    • BrightTalk Webinar – Software-Defined Data Centers (SDDC) are in your Future (if not already here)
    • Microsoft TechNet: Understand the cache in Storage Spaces Direct
    • BrightTalk Weibniar – Software-Defined Data Infrastructures Enabling Software-Defined Data Centers
    • Happy 20th Birthday Windows Server, ready for Server 2016?
    • Server StorageIO resources including added links, tools, reports, events and more.

    What This All Means

    While Microsoft Windows Server recently celebrated its 20th birthday (or anniversary), a lot has changed as well as evolved. This includes Windows Servers 2016 supporting new deployment and consumption models (e.g. lightweight Nano, full data center with desktop interface, on-premises, bare metal, virtualized (Hyper-V, VMware, etc) as well as cloud). Besides how consumed and configured, which can also be for CI and HCI modes, Windows Server 2016 along with Hyper-V extend the virtualization and container capabilities into non-Microsoft environments specifically around Linux and Docker. Not only are the support for those environments and platforms enhanced, so to are the management capabilities and interfaces from Powershell to Bash Linux shell being part of WIndows 10 and Server 2016.

    What this all means is that if you have not looked at Windows Server in some time, its time you do, even if you are not a WIndows or Microsoft fan, you will want to know what it is that has been updated (perhaps even update your fud if that is the case) to stay current. Get your hands on the bits and try Windows Server 2016 on a bare metal server, or as a VM guest, or via cloud including Azure, or simply leverage the above resources to learn more and stay informed.

    Ok, nuff said, for now…

    Cheers
    Gs

    Greg Schulz – Microsoft MVP Cloud and Data Center Management, vSAN and VMware vExpert. Author Cloud and Virtual Data Storage Networking (CRC Press), The Green and Virtual Data Center (CRC Press) and Resilient Storage Networks (Elsevier) and twitter @storageio

    All Comments, (C) and (TM) belong to their owners/posters, Other content (C) Copyright 2006-2023 Server StorageIO(R) and UnlimitedIO All Rights Reserved

    Server storage I/O performance benchmark workload scripts Part I

    Server storage I/O performance benchmark workload scripts Part I

    Server storage I/O performance benchmark workload scripts

    Update 1/28/2018

    This is part one of a two-part series of posts about Server storage I/O performance benchmark workload tools and scripts. View part II here which includes the workload scripts and where to view sample results.

    There are various tools and workloads for server I/O benchmark testing, validation and exercising different storage devices (or systems and appliances) such as Non-Volatile Memory (NVM) flash Solid State Devices (SSDs) or Hard Disk Drives (HDD) among others.

    NVMe ssd storage
    Various NVM flash SSD including NVMe devices

    For example, lets say you have an SSD such as an Intel 750 (here, here, and here) or some other vendors NVMe PCIe Add in Card (AiC) installed into a Microsoft Windows server and would like to see how it compares with expected results. The following scripts allow you to validate your system with those of others running the same workload, granted of course your mileage (performance) may vary.

    server storage I/O SCM NVM SSD performance

    Why Your Performance May Vary

    Reasons you performance may vary include among others:

    • GHz Speed of your server, number of sockets, cores
    • Amount of main DRAM memory
    • Number, type and speed of PCIe slots
    • Speed of storage device and any adapters
    • Device drivers and firmware of storage devices and adapters
    • Server power mode setting (e.g. low or balanced power vs. high-performance)
    • Other workload running on system and device under test
    • Solar flares (kp-index) among other urban (or real) myths and issues
    • Typos or misconfiguration of workload test scripts
    • Test server, storage, I/O device, software and workload configuration
    • Versions of test software tools among others

    Windows Power (and performance) Settings

    Some things are assumed or taken for granted that everybody knows and does, however sometimes the obvious needs to be stated or re-stated. An example is remembering to check your server power management settings to see if they are in energy efficiency power savings mode, or, in high-performance mode. Note that if your focus is on getting the best possible performance for effective productivity, then you want to be in high performance mode. On the other hand if performance is not your main concern, instead a focus on energy avoidance, then low power mode, or perhaps balanced.

    For Microsoft Windows Servers, Desktop Workstations, Laptops and Tablets you can adjust power settings via control panel and GUI as well as command line or Powershell. From command line (privileged or administrator) the following are used for setting balanced or high-performance power settings.

    Balanced

    powercfg.exe /setactive 381b4222-f694-41f0-9685-ff5bb260df2e

    High Performance

    powercfg.exe /setactive 8c5e7fda-e8bf-4a96-9a85-a6e23a8c635c

    From Powershell the following set balanced or high-performance.

    Balanced
    PowerCfg -SetActive "381b4222-f694-41f0-9685-ff5bb260df2e"

    High Performance
    PowerCfg -SetActive "8c5e7fda-e8bf-4a96-9a85-a6e23a8c635c"

    Note that you can list Windows power management settings using powercfg -LIST and powercfg -QUERY

    server storage I/O power management

    Btw, if you have not already done so, enable Windows disk (HDD and SSD) performance counters so that they appear via Task Manager by entering from a command prompt:

    diskperf -y

    Workload (Benchmark) Simulation Test Tools Used

    There are many tools (see storageio.com/performance) that can be used for creating and running workloads just as there are various application server I/O characteristics. Different server I/O and application performance attributes include among others read vs. write, random vs. sequential, large vs. small, long vs. short stride, burst vs. sustain, cache and non-cache friendly, activity vs. data movement vs. latency vs. CPU usage among others. Likewise the number of workers, jobs, threads, outstanding and overlapped I/O among other configuration settings can have an impact on workload and results.

    The four free tools that I’m using with this set of scripts are:

    • Microsoft Diskspd (free), get the tool and bits here or here (open source), learn more about Diskspd here.
    • FIO.exe (free), get the tool and bits here or here among other venues.
    • Vdbench (free with registration), get the tool and bits here or here among other venues.
    • Iometer (free), get the tool and bits here among other venues.

    Notice: While best effort has been made to verify the above links, they may change over time and you are responsible for verifying the safety of links and your downloads.

    Where To Learn More

    Additional learning experiences along with common questions (and answers), as well as tips can be found in Software Defined Data Infrastructure Essentials book.

    Software Defined Data Infrastructure Essentials Book SDDC

    What This All Means

    Remember, everything is not the same in the data center or with data infrastructures that support different applications.

    While some tools are more robust or better than others for different things, ultimately it’s usually not the tool that results in a bad benchmark or comparison, it’s the configuration or lack of including workload settings that are not relevant or applicable. The best benchmark, workload or simulation is your own application. Second best is one that closely resembles your application workload characteristics. A bad benchmark is one that has no relevance to your environment, application use scenario. Take and treat all benchmark or workload simulation results with a grain of salt as something to compare, contrast or make reference to in the proper context. Read part two of this post series to view test tool workload scripts along with sample results.

    Ok, nuff said, for now.

    Gs

    Greg Schulz – Microsoft MVP Cloud and Data Center Management, VMware vExpert 2010-2017 (vSAN and vCloud). Author of Software Defined Data Infrastructure Essentials (CRC Press), as well as Cloud and Virtual Data Storage Networking (CRC Press), The Green and Virtual Data Center (CRC Press), Resilient Storage Networks (Elsevier) and twitter @storageio. Courteous comments are welcome for consideration. First published on https://storageioblog.com any reproduction in whole, in part, with changes to content, without source attribution under title or without permission is forbidden.

    All Comments, (C) and (TM) belong to their owners/posters, Other content (C) Copyright 2006-2024 Server StorageIO and UnlimitedIO. All Rights Reserved. StorageIO is a registered Trade Mark (TM) of Server StorageIO.

    Part II – Some server storage I/O workload scripts and results

    Part II – Some server storage I/O workload scripts and results

    server storage I/O trends

    Updated 1/28/2018

    This is the second in a two part series of posts pertaining to using some common server storage I/O workload benchmark tools and scripts. View part I here which includes overview, background and information about the tools used and related topics.

    NVMe ssd storage
    Various NVM flash SSD including NVMe devices

    Following are some server I/O benchmark workload scripts to exercise various storage devices such as Non-Volatile Memory (NVM) flash Solid State Devices (SSDs) or Hard Disk Drives (HDD) among others.

    The Workloads

    Some ways that can impact the workload performance results besides changing the I/O size, read write, random sequential mix is the number of threads, workers and jobs. Note that in the workload steps, the larger 1MB and sequential scenarios have fewer threads, workers vs. the smaller IOP or activity focused workloads. Too many threads or workers can cause overhead and you will reach a point of diminishing return at some point. Likewise too few and you will not drive the system under test (SUT) or device under test (DUT) to its full potential. If you are not sure how many threads or workers to use, run some short calibration tests to see the results before doing a large, longer test.

    Keep in mind that the best benchmark or workload is your own application running with similar load to what you would see in real world, along with applicable features, configuration and functionality enabled. The second best would be those that closely resemble your workload characteristics and that are relevant.

    The following workloads involved a system test initiator (STI) server driving workload using the different tools as well as scripts shown. The STI sends the workload to a SUT or DUT that can be a single drive, card or multiple devices, storage system or appliance. Warning: The following workload tests does both reads and writes which can be destructive to your device under test. Exercise caution on the device and file name specified to avoid causing a problem that might result in you testing your backup / recovery process. Likewise no warranty is given, implied or made for these scripts or their use or results, they are simply supplied as is for your reference.

    The four free tools that I’m using with this set of scripts are:

    • Microsoft Diskspd (free), get the tool and bits here or here (open source), learn more about Diskspd here.
    • FIO.exe (free), get the tool and bits here or here among other venues.
    • Vdbench (free with registration), get the tool and bits here or here among other venues.
    • Iometer (free), get the tool and bits here among other venues.

    Notice: While best effort has been made to verify the above links, they may change over time and you are responsible for verifying the safety of links and your downloads

    Microsoft Diskspd workloads

    Note that a 300GB size file named iobw.tst on device N: is being used for performing read and write I/Os to. There are 160 threads, I/O size of 4KB and 8KB varying from 100% Read (0% write), 70% Read (30% write) and 0% Read (100% write) with random (seek) and no hardware or software cache. Also specified are to collect latency statistics, a 30 second warm up ramp up time, and a quick 5 minute duration (test time). 5 minutes is a quick test for calibration, verify your environment however relatively short for a real test which should be in the hours or more depending on your needs.

    Note that the output results are put into a file with a name describing the test tool, workload and other useful information such as date and time. You may also want to specify a different directory where output files are placed.

    diskspd.exe -c300G -o160 -t160 -b4K -w0 -W30 -d300 -h -fr  N:iobw.tst -L  > DiskSPD_300G_4KRan100Read_160x160_072416_8AM.txt
    diskspd.exe -c300G -o160 -t160 -b4K -w30 -W30 -d300 -h -fr  N:iobw.tst -L  > DiskSPD_300G_4KRan70Read_160x160_072416_8AM.txt
    diskspd.exe -c300G -o160 -t160 -b4K -w100 -W30 -d300 -h -fr  N:iobw.tst -L  > DiskSPD_300G_4KRan0Read_160x160_072416_8AM.txt
    diskspd.exe -c300G -o160 -t160 -b8K -w0 -W30 -d300 -h -fr  N:iobw.tst -L  > DiskSPD_300G_8KRan100Read_160x160_072416_8AM.txt
    diskspd.exe -c300G -o160 -t160 -b8K -w30 -W30 -d300 -h -fr  N:iobw.tst -L  > DiskSPD_300G_8KRan70Read_160x160_072416_8AM.txt
    diskspd.exe -c300G -o160 -t160 -b8K -w100 -W30 -d300 -h -fr  N:iobw.tst -L  > DiskSPD_300G_8KRan0Read_160x160_072416_8AM.txt
    

    The following Diskspd tests use similar settings as above, however instead of random, sequential is specified, threads and outstanding I/Os are reduced while I/O size is set to 1MB, then 8KB, with 100% read and 100% write scenarios. The -t specifies the number of threads and -o number of outstanding I/Os per thread.

    diskspd.exe -c300G -o32 -t132 -b1M -w0 -W30 -d300 -h -si  N:iobw.tst -L  > DiskSPD_300G_1MSeq100Read_32x32_072416_8AM.txt
    diskspd.exe -c300G -o32 -t132 -b1M -w100 -W30 -d300 -h -si  N:iobw.tst -L  > DiskSPD_300G_1MSeq0Read_32x32_072416_8AM.txt
    diskspd.exe -c300G -o160 -t160 -b8K -w0 -W30 -d300 -h -si  N:iobw.tst -L  > DiskSPD_300G_8KSeq100Read_32x32_072416_8AM.txt
    diskspd.exe -c300G -o160 -t160 -b8K -w100 -W30 -d300 -h -si  N:iobw.tst -L  > DiskSPD_300G_8KSeq0Read_32x32_072416_8AM.txt
    

    Fio.exe workloads

    Next are the fio workloads similar to those run using Diskspd except the sequential scenarios are skipped.

    fio --filename=N\:\iobw.tst --filesize=300000M --direct=1  --rw=randrw --refill_buffers --norandommap --randrepeat=0 --ioengine=windowsaio  --ba=4k --bs=4k --rwmixread=100 --iodepth=32 --numjobs=5 --exitall --time_based  --ramp_time=30 --runtime=300 --group_reporting --name=xxx  --output=FIO_300000M_4KRan100Read_5x32_072416_8AM.txt
    fio --filename=N\:\iobw.tst --filesize=300000M --direct=1  --rw=randrw --refill_buffers --norandommap --randrepeat=0 --ioengine=windowsaio  --ba=4k --bs=4k --rwmixread=70 --iodepth=32 --numjobs=5 --exitall --time_based  --ramp_time=30 --runtime=300 --group_reporting --name=xxx  --output=FIO_300000M_4KRan70Read_5x32_072416_8AM.txt
    fio --filename=N\:\iobw.tst --filesize=300000M --direct=1  --rw=randrw --refill_buffers --norandommap --randrepeat=0 --ioengine=windowsaio  --ba=4k --bs=4k --rwmixread=0 --iodepth=32 --numjobs=5 --exitall --time_based  --ramp_time=30 --runtime=300 --group_reporting --name=xxx  --output=FIO_300000M_4KRan0Read_5x32_072416_8AM.txt
    fio --filename=N\:\iobw.tst --filesize=300000M --direct=1  --rw=randrw --refill_buffers --norandommap --randrepeat=0 --ioengine=windowsaio  --ba=8k --bs=8k --rwmixread=100 --iodepth=32 --numjobs=5 --exitall --time_based  --ramp_time=30 --runtime=300 --group_reporting --name=xxx  --output=FIO_300000M_8KRan100Read_5x32_072416_8AM.txt
    fio --filename=N\:\iobw.tst --filesize=300000M --direct=1  --rw=randrw --refill_buffers --norandommap --randrepeat=0 --ioengine=windowsaio  --ba=8k --bs=8k --rwmixread=70 --iodepth=32 --numjobs=5 --exitall --time_based  --ramp_time=30 --runtime=300 --group_reporting --name=xxx  --output=FIO_300000M_8KRan70Read_5x32_072416_8AM.txt
    fio --filename=N\:\iobw.tst --filesize=300000M --direct=1  --rw=randrw --refill_buffers --norandommap --randrepeat=0 --ioengine=windowsaio  --ba=8k --bs=8k --rwmixread=0 --iodepth=32 --numjobs=5 --exitall --time_based  --ramp_time=30 --runtime=300 --group_reporting --name=xxx  --output=FIO_300000M_8KRan0Read_5x32_072416_8AM.txt
    

    Vdbench workloads

    Next are the Vdbench workloads similar to those used with the Microsoft Diskspd scenarios. In addition to making sure Vdbench is installed and working, you will need to create a text file called seqrxx.txt containing the following:

    hd=localhost,jvms=!jvmn
    sd=sd1,lun=!drivename,openflags=directio,size=!dsize
    wd=mix,sd=sd1
    rd=!jobname,wd=mix,elapsed=!etime,interval=!itime,iorate=max,forthreads=(!tthreads),forxfersize=(!worktbd),forseekpct=(!workseek),forrdpct=(!workread),openflags=directio

    The following are the commands that call the Vdbench script file. Note Vdbench puts output files (yes, plural there are many results) in a output folder.

    vdbench -f seqrxx.txt dsize=300G  tthreads=160 jvmn=64 worktbd=4k workseek=100 workread=100 jobname=NVME etime=300 itime=30 drivename="\\.\N:\iobw.tst" -o  vdbench_NNVMe_300GB_64JVM_160TH_4K100Ran100Read_0726166AM
    vdbench -f seqrxx.txt dsize=300G  tthreads=160 jvmn=64 worktbd=4k workseek=100 workread=70 jobname=NVME etime=300 itime=30 drivename="\\.\N:\iobw.tst" -o vdbench_NNVMe_300GB_64JVM_160TH_4K100Ran70Read_072416_8AM
    vdbench -f seqrxx.txt dsize=300G  tthreads=160 jvmn=64 worktbd=4k workseek=100 workread=0 jobname=NVME etime=300 itime=30 drivename="\\.\N:\iobw.tst" -o vdbench_NNVMe_300GB_64JVM_160TH_4K100Ran0Read_072416_8AM
    vdbench -f seqrxx.txt dsize=300G  tthreads=160 jvmn=64 worktbd=8k workseek=100 workread=100 jobname=NVME etime=300 itime=30 drivename="\\.\N:\iobw.tst" -o vdbench_NNVMe_300GB_64JVM_160TH_8K100Ran100Read_072416_8AM
    vdbench -f seqrxx.txt dsize=300G  tthreads=160 jvmn=64 worktbd=8k workseek=100 workread=70 jobname=NVME etime=300 itime=30 drivename="\\.\N:\iobw.tst" -o vdbench_NNVMe_300GB_64JVM_160TH_8K100Ran70Read_072416_8AM
    vdbench -f seqrxx.txt dsize=300G  tthreads=160 jvmn=64 worktbd=8k workseek=100 workread=0 jobname=NVME etime=300 itime=30 drivename="\\.\N:\iobw.tst" -o vdbench_NNVMe_300GB_64JVM_160TH_8K100Seq0Read_072416_8AM
    vdbench -f seqrxx.txt dsize=300G  tthreads=160 jvmn=64 worktbd=8k workseek=0 workread=100 jobname=NVME etime=300 itime=30 drivename="\\.\N:\iobw.tst" -o vdbench_NNVMe_300GB_64JVM_160TH_8K100Seq100Read_072416_8AM
    vdbench -f seqrxx.txt dsize=300G  tthreads=160 jvmn=64 worktbd=8k workseek=0 workread=70 jobname=NVME etime=300 itime=30 drivename="\\.\N:\iobw.tst" -o vdbench_NNVMe_300GB_64JVM_160TH_8K100Seq70Read_072416_8AM
    vdbench -f seqrxx.txt dsize=300G  tthreads=160 jvmn=64 worktbd=8k workseek=0 workread=0 jobname=NVME etime=300 itime=30 drivename="\\.\N:\iobw.tst" -o vdbench_NNVMe_300GB_64JVM_160TH_8K100Seq0Read_072416_8AM
    vdbench -f seqrxx.txt dsize=300G  tthreads=32 jvmn=64 worktbd=1M workseek=0 workread=100 jobname=NVME etime=300 itime=30 drivename="\\.\N:\iobw.tst" -o vdbench_NNVMe_300GB_64JVM_32TH_1M100Seq100Read_072416_8AM
    vdbench -f seqrxx.txt dsize=300G  tthreads=32 jvmn=64 worktbd=1M workseek=0 workread=0 jobname=NVME etime=300 itime=30 drivename="\\.\N:\iobw.tst" -o vdbench_NNVMe_300GB_64JVM_32TH_1M100Seq0Read_072416_8AM
    

    Iometer workloads

    Last however not least, lets do an Iometer run. The following command calls an Iometer input file (icf) that you can find here. In that file you will need to make a few changes including the name of the server where Iometer is running, description and device under test address. For example in the icf file change SIOSERVER to the name of the server where you will be running Iometer from. Also change the address for the DUT, for example N: to what ever address, drive, mount point you are using. Also update the description accordingly (e.g. "NVME" to "Your test example".

    Here is the command line to run Iometer specifying an icf and where to put the results in a CSV file that can be imported into Excel or other tools.

    iometer /c  iometer_5work32q_intel_Profile.icf /r iometer_nvmetest_5work32q_072416_8AM.csv
    

    server storage I/O SCM NVM SSD performance

    What About The Results?

    For context, the following results were run on a Lenovo TS140 (32GB RAM), single socket quad core (3.2GHz) Intel E3-1225 v3 with an Intel NVMe 750 PCIe AiC (Intel SSDPEDMW40). Out of the box Microsoft Windows NVMe drive and controller drivers were used (e.g. 6.3.9600.18203 and 6.3.9600.16421). Operating system is Windows 2012 R2 (bare metal) with NVMe PCIe card formatted with ReFS file system. Workload generator and benchmark driver tools included Microsoft Diskspd version 2.012, Fio.exe version 2.2.3, Vdbench 50403 and Iometer 1.1.0. Note that there are newer versions of the various workload generation tools.

    Example results are located here.

    Where To Learn More

    Additional learning experiences along with common questions (and answers), as well as tips can be found in Software Defined Data Infrastructure Essentials book.

    Software Defined Data Infrastructure Essentials Book SDDC

    What This All Means

    Remember, everything is not the same in the data center or with data infrastructures that support different applications.

    While some tools are more robust or better than others for different things, ultimately its usually not the tool that results in a bad benchmark or comparison, its the configuration or lack of including workload settings that are not relevant or applicable. The best benchmark, workload or simulation is your own application. Second best is one that closely resembles your application workload characteristics. A bad benchmark is one that has no relevance to your environment, application use scenario. Take and treat all benchmark or workload simulation results with a grain of salt as something to compare, contrast or make reference to in the proper context.

    Ok, nuff said, for now.

    Gs

    Greg Schulz – Microsoft MVP Cloud and Data Center Management, VMware vExpert 2010-2017 (vSAN and vCloud). Author of Software Defined Data Infrastructure Essentials (CRC Press), as well as Cloud and Virtual Data Storage Networking (CRC Press), The Green and Virtual Data Center (CRC Press), Resilient Storage Networks (Elsevier) and twitter @storageio. Courteous comments are welcome for consideration. First published on https://storageioblog.com any reproduction in whole, in part, with changes to content, without source attribution under title or without permission is forbidden.

    All Comments, (C) and (TM) belong to their owners/posters, Other content (C) Copyright 2006-2024 Server StorageIO and UnlimitedIO. All Rights Reserved. StorageIO is a registered Trade Mark (TM) of Server StorageIO.

    Which Enterprise HDD for Content Server Platform

    Which Enterprise HDD to use for a Content Server Platform

    data infrastructure HDD server storage I/O trends

    Updated 1/23/2018

    Which enterprise HDD to use with a content server platform?

    Insight for effective server storage I/O decision making
    Server StorageIO Lab Review

    Which enterprise HDD to use for content servers

    This post is the first in a multi-part series based on a white paper hands-on lab report I did compliments of Equus Computer Systems and Seagate that you can read in PDF form here. The focus is looking at the Equus Computer Systems (www.equuscs.com) converged Content Solution platforms with Seagate Enterprise Hard Disk Drive (HDD’s). I was given the opportunity to do some hands-on testing running different application workloads with a 2U content solution platform along with various Seagate Enterprise 2.5” HDD’s handle different application workloads. This includes Seagate’s Enterprise Performance HDD’s with the enhanced caching feature.

    Issues And Challenges

    Even though Non-Volatile Memory (NVM) including NAND flash solid state devices (SSDs) have become popular storage for use internal as well as external to servers, there remains the need for HDD’s Like many of you who need to make informed server, storage, I/O hardware, software and configuration selection decisions, time is often in short supply.

    A common industry trend is to use SSD and HDD based storage mediums together in hybrid configurations. Another industry trend is that HDD’s continue to be enhanced with larger space capacity in the same or smaller footprint, as well as with performance improvements. Thus, a common challenge is what type of HDD to use for various content and application workloads balancing performance, availability, capacity and economics.

    Content Applications and Servers

    Fast Content Needs Fast Solutions

    An industry and customer trend are that information and data are getting larger, living longer, as well as there is more of it. This ties to the fundamental theme that applications and their underlying hardware platforms exist to process, move, protect, preserve and serve information.

    Content solutions span from video (4K, HD, SD and legacy streaming video, pre-/post-production, and editing), audio, imaging (photo, seismic, energy, healthcare, etc.) to security surveillance (including Intelligent Video Surveillance [ISV] as well as Intelligence Surveillance and Reconnaissance [ISR]). In addition to big fast data, other content solution applications include content distribution network (CDN) and caching, network function virtualization (NFV) and software-defined network (SDN), to cloud and other rich unstructured big fast media data, analytics along with little data (e.g. SQL and NoSQL database, key-value stores, repositories and meta-data) among others.

    Content Solutions And HDD Opportunities

    A common theme with content solutions is that they get defined with some amount of hardware (compute, memory and storage, I/O networking connectivity) as well as some type of content software. Fast content applications need fast software, multi-core processors (compute), large memory (DRAM, NAND flash, SSD and HDD’s) along with fast server storage I/O network connectivity. Content-based applications benefit from having frequently accessed data as close as possible to the application (e.g. locality of reference).

    Content solution and application servers need flexibility regarding compute options (number of sockets, cores, threads), main memory (DRAM DIMMs), PCIe expansion slots, storage slots and other connectivity. An industry trend is leveraging platforms with multi-socket processors, dozens of cores and threads (e.g. logical processors) to support parallel or high-concurrent content applications. These servers have large amounts of local storage space capacity (NAND flash SSD and HDD) and associated I/O performance (PCIe, NVMe, 40 GbE, 10 GbE, 12 Gbps SAS etc.) in addition to using external shared storage (local and cloud).

    Where To Learn More

    Additional learning experiences along with common questions (and answers), as well as tips can be found in Software Defined Data Infrastructure Essentials book.

    Software Defined Data Infrastructure Essentials Book SDDC

    What This All Means

    Fast content applications need fast content and flexible content solution platforms such as those from Equus Computer Systems and HDD’s from Seagate. Key to a successful content application deployment is having the flexibility to hardware define and software defined the platform to meet your needs. Just as there are many different types of content applications along with diverse environments, content solution platforms need to be flexible, scalable and robust, not to mention cost effective.

    Continue reading part two of this multi-part series here where we look at how and what to test as well as project planning.

    Ok, nuff said, for now.

    Gs

    Greg Schulz – Microsoft MVP Cloud and Data Center Management, VMware vExpert 2010-2017 (vSAN and vCloud). Author of Software Defined Data Infrastructure Essentials (CRC Press), as well as Cloud and Virtual Data Storage Networking (CRC Press), The Green and Virtual Data Center (CRC Press), Resilient Storage Networks (Elsevier) and twitter @storageio. Courteous comments are welcome for consideration. First published on https://storageioblog.com any reproduction in whole, in part, with changes to content, without source attribution under title or without permission is forbidden.

    All Comments, (C) and (TM) belong to their owners/posters, Other content (C) Copyright 2006-2024 Server StorageIO and UnlimitedIO. All Rights Reserved. StorageIO is a registered Trade Mark (TM) of Server StorageIO.

    Part 2 – Which HDD for Content Applications – HDD Testing

    Part 2 – Which HDD for Content Applications – HDD Testing

    HDD testing server storage I/O trends

    Updated 1/23/2018

    Which enterprise HDD to use with a content server, hdd testing, how and what to do

    Insight for effective server storage I/O decision making
    Server StorageIO Lab Review

    Which enterprise HDD to use for content servers

    This is the second in a multi-part series (read part one here) based on a white paper hands-on lab report I did compliments of Servers Direct and Seagate that you can read in PDF form here. The focus is looking at the Servers Direct (www.serversdirect.com) converged Content Solution platforms with Seagate Enterprise Hard Disk Drive (HDD’s). In this post we look at some decisions and configuration choices to make for testing content applications servers as well as project planning.

    Content Solution Test Objectives

    In short period, collect performance and another server, storage I/O decision-making information on various HDD’s running different content workloads.

    Working with the Servers Direct staff a suitable content solution platform test configuration was created. In addition to providing two Intel-based content servers, Servers Direct worked with their partner Seagate to arrange for various enterprise-class HDD’s to be evaluated. For these series of content application tests, being short on time, I chose to do run some simple workloads including database, basic file (large and small) processing and general performance characterization.

    Content Solution Decision Making

    Knowing how Non-Volatile Memory (NVM) NAND flash SSD (1) devices (drives and PCIe cards) perform, what would be the best HDD based storage option for my given set of applications? Different applications have various performance, capacity and budget considerations. Different types of Seagate Enterprise class 2.5” Small Form Factor (SFF) HDD’s were tested.

    While revolutions per minute (RPM) still plays a role in HDD performance, there are other factors including internal processing capabilities, software or firmware algorithm optimization, and caching. Most HDD’s today have some amount of DRAM for read caching and other operations. Seagate Enterprise Performance HDD’s with the enhanced caching feature (2) are examples of devices accelerate storage I/O speed vs. traditional 10K and 15K RPM drives.

    Project Planning And Preparation

    Workload to be tested included:

    • Database read/writes
    • Large file processing
    • Small file processing
    • General I/O profile

    Project testing consisted of five phases, some of which overlapped with others:

    Phase 1 – Plan
    Identify candidate workloads that could be run in the given amount of time, determine time schedules and resource availability, create a project plan.

    Phase 2 – Define
    Hardware define and software define the test platform.

    Phase 3 – Setup
    The objective was to assess plug-play capability of the server, storage and I/O networking hardware with a Linux OS before moving on to the reported workloads in the next phase. Initial setup and configuration of hardware and software, installation of additional devices along with software configuration, troubleshooting, and learning as applicable. This phase consisted of using Ubuntu Linux 14.04 server as the operating system (OS) along with MySQL 5.6 as a database server during initial hands-on experience.

    Phase 4 – Execute
    This consisted of using Windows 2012 R2 server as the OS along with Microsoft SQL Server on the system under test (SUT) to support various workloads. Results of this phase are reported below.

    Phase 5 – Analyze      
    Results from the workloads run in phase 3 were analyzed and summarized into this document.

    (Note 1) Refer to Seagate 1200 12 Gbps Enterprise SAS SSD StorageIO lab review

    (Note 2) Refer to Enterprise SSHD and Flash SSD Part of an Enterprise Tiered Storage Strategy

    Planning And Preparing The Tests

    As with most any project there were constraints to contend with and work around.

    Test constraints included:

    • Short-time window
    • Hardware availability
    • Amount of hardware
    • Software availability

    Three most important constraints and considerations for this project were:

    • Time – This was a project with a very short time “runway”, something common in most customer environments who are looking to make a knowledgeable server, storage I/O decisions.
    • Amount of hardware – Limited amount of DRAM main memory, sixteen 2.5” internal hot-swap storage slots for HDD’s as well as SSDs. Note that for a production content solution platform; additional DRAM can easily be added, along with extra external storage enclosures to scale memory and storage capacity to fit your needs.
    • Software availability – Utilize common software and management tools publicly available so anybody could leverage those in their own environment and tests.

    The following content application workloads were profiled:

    • Database reads/writes – Updates, inserts, read queries for a content environment
    • Large file processing – Streaming of large video, images or other content objects.
    • Small file processing – Processing of many small files found in some content applications
    • General I/O profile – IOP, bandwidth and response time relevant to content applications

    Where To Learn More

    Additional learning experiences along with common questions (and answers), as well as tips can be found in Software Defined Data Infrastructure Essentials book.

    Software Defined Data Infrastructure Essentials Book SDDC

    What This All Means

    There are many different types of content applications ranging from little data databases to big data analytics as well as very big fast data such as for video. Likewise there are various workloads and characteristics to test. The best test and metrics are those that apply to your environment and application needs.

    Continue reading part three of this multi-part series here looking at how the systems and HDD’s were configured and tested.

    Ok, nuff said, for now.

    Gs

    Greg Schulz – Microsoft MVP Cloud and Data Center Management, VMware vExpert 2010-2017 (vSAN and vCloud). Author of Software Defined Data Infrastructure Essentials (CRC Press), as well as Cloud and Virtual Data Storage Networking (CRC Press), The Green and Virtual Data Center (CRC Press), Resilient Storage Networks (Elsevier) and twitter @storageio. Courteous comments are welcome for consideration. First published on https://storageioblog.com any reproduction in whole, in part, with changes to content, without source attribution under title or without permission is forbidden.

    All Comments, (C) and (TM) belong to their owners/posters, Other content (C) Copyright 2006-2024 Server StorageIO and UnlimitedIO. All Rights Reserved. StorageIO is a registered Trade Mark (TM) of Server StorageIO.

    Part 3 – Which HDD for content applicaitons – Test Configuration

    Which HDD for content applications – HDD Test Configuration

    HDD Test Configuration server storage I/O trends

    Updated 1/23/2018

    Which enterprise HDD to use with a content server platform hdd test configuratoin

    Insight for effective server storage I/O decision making
    Server StorageIO Lab Review

    Which enterprise HDD to use for content servers

    This is the third in a multi-part series (read part two here) based on a white paper hands-on lab report I did compliments of Servers Direct and Seagate that you can read in PDF form here. The focus is looking at the Servers Direct (www.serversdirect.com) converged Content Solution platforms with Seagate Enterprise Hard Disk Drive (HDD’s). In this post the focus expands to hardware and software defining as well as configuring the test environments along with applications workloads.

    Defining Hardware Software Environment

    Servers Direct content platforms are software defined and hardware defined to your specific solution needs. For my test-drive, I used a pair of 2U Content Solution platforms, one for a client System Test Initiator (STI) (3), the other as server SUT shown in figure-1 (next page). With the STI configured and SUT setup Seagate Enterprise class 2.5” 12Gbps SAS HDD’s were added to the configuration.

    (Note 3) System Test Initiator (STI) was hardware defined with dual Intel Xeon E5-2695 v3 (2.30 GHz) processors, 32GB RAM running Windows Server 2012 R2 with two network connections to the SUT. Network connections from the STI to SUT included an Intel GbE X540-AT2 as well as an Intel XL710 Q2 40 GbE Converged Network Adapter (CNA). In addition to software defining the STI with Windows Server 2012 R2, Dell Benchmark Factory (V7.1 64b bit 496) part of the Database Administrators (DBA) Toad Tools (including free versions) was also used. For those familiar with HammerDB, Sysbench among others, Benchmark Factory is an alternative that supports various workloads and database connections with robust reporting, scripting and automation. Other installed tools included Spotlight on Windows, Iperf 2.0.5 for generating network traffic and reporting results, as well as Vdbench with various scripts.

    SUT setup (4)  included four Enterprise 10K and two 15K Performance drives with enhanced performance caching feature enabled, along with two Enterprise Capacity 2TB HDD’s, all were attached to an internal 12Gbps SAS RAID controller. With the STI configured and SUT setup Seagate Enterprise class 2.5” 12Gbps SAS HDD’s were added to the configuration.

    (Note 4) System Under Test (SUT) dual Intel Xeon E5-2697 v3 (2.60 GHz) providing 54 logical processors, 64GB of RAM (expandable to 768GB with 32GB DIMMs, or 3TB with 128GB DIMMs) and two network connections. Network connections from the STI to SUT consisting of an Intel 1 GbE X540-AT2 as well as an Intel XL710 Q2 40 GbE CNA. The GbE LAN connection was used for management purposes while the 40 GbE was used for data traffic. System disk was a 6Gbs SATA flash SSD. Seagate Enterprise class HDD’s were installed into the 16 available 2.5” small form factor (SFF) drive slots. Eight (left most) drive slots were connected to an Intel RMS3CC080 12 Gbps SAS RAID internal controller. The “Blue” drives in the middle were connected to both an NVMe PCIe card and motherboard 6 Gbps SATA controller using an SFF-8637 connector. The four right most drives were also connected to the motherboard 6 Gbps SATA controller.

    System Test Configuration
    Figure-1 STI and SUT hardware as well as software defined test configuration

    This included four Enterprise 10K and two 15K Performance drives with enhanced performance caching feature enabled, along with two Enterprise Capacity 2TB HDD’s, all were attached to an internal 12Gbps SAS RAID controller. Five 6 Gbps SATA Enterprise Capacity 2TB HDD’s were setup using Microsoft Windows as a spanned volume. System disk was a 6Gbps flash SSD and an NVMe flash SSD drive was used for database temp space.

    What About NVM Flash SSD?

    NAND flash and other Non-Volatile Memory (NVM) memory and SSD complement content solution. A little bit of flash SSD in the right place can have a big impact. The focus for theses tests is HDD’s, however some flash SSDs were used as system boot and database temp (e.g. tempdb) space. Refer to StorageIO Lab reviews and visit www.thessdplace.com

    Seagate Enterprise HDD’s Used During Testing

    Various Seagate Enterprise HDD specifications use in the testing are shown below in table-1.


    Qty


    Seagate HDD’s


    Capacity


    RPM


    Interface


    Size


    Model

    Servers Direct Price Each

    Configuration

    4

    Enterprise 10K
    Performance

    1.8TB

    10K with cache

    12 Gbps SAS

    2.5”

    ST1800MM0128
    with enhanced cache

    $875.00 USD

    HW(5) RAID 10 and RAID 1

    2

    Enterprise
    Capacity 7.2K

    2TB

    7.2K

    12 Gbps SAS

    2.5”

    ST2000NX0273

    $399.00 USD

    HW RAID 1

    2

    Enterprise 15K
    Performance

    600GB

    15K with cache

    12 Gbps SAS

    2.5”

    ST600MX0082
    with enhanced cache

    $595.00 USD

    HW RAID 1

    5

    Enterprise
    Capacity 7.2K

    2TB

    7.2K

    6 Gbps SATA

    2.5”

    ST2000NX0273

    $399.00 USD

    SW(6) RAID Span Volume

    Table-1 Seagate Enterprise HDD specification and Servers Direct pricing

    URLs for additional Servers Direct content platform information:
    https://serversdirect.com/solutions/content-solutions
    https://serversdirect.com/solutions/content-solutions/video-streaming
    https://www.serversdirect.com/File%20Library/Data%20Sheets/Intel-SDR-2P16D-001-ds2.pdf

    URLs for additional Seagate Enterprise HDD information:
    https://serversdirect.com/Components/Drives/id-HD1558/Seagate_ST2000NX0273_2TB_Hard_Drive

    https://serversdirect.com/Components/Drives/id-HD1559/Seagate_ST600MX0082_SSHD

    Seagate Performance Enhanced Cache Feature

    The Enterprise 10K and 15K Performance HDD’s tested had the enhanced cache feature enabled. This feature provides a “turbo” boost like acceleration for both reads and write I/O operations. HDD’s with enhanced cache feature leverage the fact that some NVM such as flash in the right place can have a big impact on performance (7).

    In addition to their performance benefit, combing a best of or hybrid storage model (combing flash with HDD’s along with software defined cache algorithms), these devices are “plug-and-play”. By being “plug-and-play” no extra special adapters, controllers, device drivers, tiering or cache management software tools are required.

    (Note 5) Hardware (HW) RAID using Intel server on-board LSI based 12 Gbps SAS RAID card, RAID 1 with two (2) drives, RAID 10 with four (4) drives. RAID configured in write-through mode with default stripe / chunk size.

    (Note 6) Software (SW) RAID using Microsoft Windows Server 2012 R2 (span). Hardware RAID used write-through cache (e.g. no buffering) with read-ahead enabled and a default 256KB stripe/chunk size.

    (Note 7) Refer to Enterprise SSHD and Flash SSD Part of an Enterprise Tiered Storage Strategy

    The Seagate Enterprise Performance 10K and 15K with enhanced cache feature are a good example of how there is more to performance in today’s HDD’s than simply comparing RPM’s, drive form factor or interface.

    Where To Learn More

    Additional learning experiences along with common questions (and answers), as well as tips can be found in Software Defined Data Infrastructure Essentials book.

    Software Defined Data Infrastructure Essentials Book SDDC

    What This All Means

    Careful and practical planning are key steps for testing various resources as well as aligning the applicable tools, configuration to meet your needs.

    Continue reading part four of this multi-part series here where the focus expands to database application workloads.

    Ok, nuff said, for now.

    Gs

    Greg Schulz – Microsoft MVP Cloud and Data Center Management, VMware vExpert 2010-2017 (vSAN and vCloud). Author of Software Defined Data Infrastructure Essentials (CRC Press), as well as Cloud and Virtual Data Storage Networking (CRC Press), The Green and Virtual Data Center (CRC Press), Resilient Storage Networks (Elsevier) and twitter @storageio. Courteous comments are welcome for consideration. First published on https://storageioblog.com any reproduction in whole, in part, with changes to content, without source attribution under title or without permission is forbidden.

    All Comments, (C) and (TM) belong to their owners/posters, Other content (C) Copyright 2006-2024 Server StorageIO and UnlimitedIO. All Rights Reserved. StorageIO is a registered Trade Mark (TM) of Server StorageIO.

    Part 4 – Which HDD for Content Applications – Database Workloads

    Part 4 – Which HDD for Content Applications – Database Workloads

    data base server storage I/O trends

    Updated 1/23/2018
    Which enterprise HDD to use with a content server platform for database workloads

    Insight for effective server storage I/O decision making
    Server StorageIO Lab Review

    Which enterprise HDD to use for content servers

    This is the fourth in a multi-part series (read part three here) based on a white paper hands-on lab report I did compliments of Servers Direct and Seagate that you can read in PDF form here. The focus is looking at the Servers Direct (www.serversdirect.com) converged Content Solution platforms with Seagate Enterprise Hard Disk Drive (HDD’s). In this post the focus expands to database application workloads that were run to test various HDD’s.

    Database Reads/Writes

    Transaction Processing Council (TPC) TPC-C like workloads were run against the SUT from the STI. These workloads simulated transactional, content management, meta-data and key-value processing. Microsoft SQL Server 2012 was configured and used with databases (each 470GB e.g. scale 6000) created and workload generated by virtual users via Dell Benchmark Factory (running on STI Windows 2012 R2).

    A single SQL Server database instance (8) was used on the SUT, however unique databases were created for each HDD set being tested. Both the main database file (.mdf) and the log file (.ldf) were placed on the same drive set being tested, keep in mind the constraints mentioned above. As time was a constraint, database workloads were run concurrent (9) with each other except for the Enterprise 10K RAID 1 and RAID 10. Workload was run with two 10K HDD’s in a RAID 1 configuration, then another workload run with a four drive RAID 10. In a production environment, ideally the .mdf and .ldf would be placed on separate HDD’s and SSDs.

    To improve cache buffering the SQL Server database instance memory could be increased from 16GB to a larger number that would yield higher TPS numbers. Keep in mind the objective was not to see how fast I could make the databases run, rather how the different drives handled the workload.

    (Note 8) The SQL Server Tempdb was placed on a separate NVMe flash SSD, also the database instance memory size was set to 16GB which was shared by all databases and virtual users accessing it.

    (Note 9) Each user step was run for 90 minutes with a 30 minute warm-up preamble to measure steady-state operation.

    Users

    TPCC Like TPS

    Single Drive Cost per TPS

    Drive Cost per TPS

    Single Drive Cost / Per GB Raw Cap.

    Cost / Per GB Usable (Protected) Cap.

    Drive Cost (Multiple Drives)

    Protect
    Space Over head

    Cost per usable GB per TPS

    Resp. Time (Sec.)

    ENT 15K R1

    1

    23.9

    $24.94

    $49.89

    $0.99

    $0.99

    $1,190

    100%

    $49.89

    0.01

    ENT 10K R1

    1

    23.4

    $37.38

    $74.77

    $0.49

    $0.49

    $1,750

    100%

    $74.77

    0.01

    ENT CAP R1

    1

    16.4

    $24.26

    $48.52

    $0.20

    $0.20

    $ 798

    100%

    $48.52

    0.03

    ENT 10K R10

    1

    23.2

    $37.70

    $150.78

    $0.49

    $0.97

    $3,500

    100%

    $150.78

    0.07

    ENT CAP SWR5

    1

    17.0

    $23.45

    $117.24

    $0.20

    $0.25

    $1,995

    20%

    $117.24

    0.02

    ENT 15K R1

    20

    362.3

    $1.64

    $3.28

    $0.99

    $0.99

    $1,190

    100%

    $3.28

    0.02

    ENT 10K R1

    20

    339.3

    $2.58

    $5.16

    $0.49

    $0.49

    $1,750

    100%

    $5.16

    0.01

    ENT CAP R1

    20

    213.4

    $1.87

    $3.74

    $0.20

    $0.20

    $ 798

    100%

    $3.74

    0.06

    ENT 10K R10

    20

    389.0

    $2.25

    $9.00

    $0.49

    $0.97

    $3,500

    100%

    $9.00

    0.02

    ENT CAP SWR5

    20

    216.8

    $1.84

    $9.20

    $0.20

    $0.25

    $1,995

    20%

    $9.20

    0.06

    ENT 15K R1

    50

    417.3

    $1.43

    $2.85

    $0.99

    $0.99

    $1,190

    100%

    $2.85

    0.08

    ENT 10K R1

    50

    385.8

    $2.27

    $4.54

    $0.49

    $0.49

    $1,750

    100%

    $4.54

    0.09

    ENT CAP R1

    50

    103.5

    $3.85

    $7.71

    $0.20

    $0.20

    $ 798

    100%

    $7.71

    0.45

    ENT 10K R10

    50

    778.3

    $1.12

    $4.50

    $0.49

    $0.97

    $3,500

    100%

    $4.50

    0.03

    ENT CAP SWR5

    50

    109.3

    $3.65

    $18.26

    $0.20

    $0.25

    $1,995

    20%

    $18.26

    0.42

    ENT 15K R1

    100

    190.7

    $3.12

    $6.24

    $0.99

    $0.99

    $1,190

    100%

    $6.24

    0.49

    ENT 10K R1

    100

    175.9

    $4.98

    $9.95

    $0.49

    $0.49

    $1,750

    100%

    $9.95

    0.53

    ENT CAP R1

    100

    59.1

    $6.76

    $13.51

    $0.20

    $0.20

    $ 798

    100%

    $13.51

    1.66

    ENT 10K R10

    100

    560.6

    $1.56

    $6.24

    $0.49

    $0.97

    $3,500

    100%

    $6.24

    0.14

    ENT CAP SWR5

    100

    62.2

    $6.42

    $32.10

    $0.20

    $0.25

    $1,995

    20%

    $32.10

    1.57

    Table-2 TPC-C workload results various number of users across different drive configurations

    Figure-2 shows TPC-C TPS (red dashed line) workload scaling over various number of users (1, 20, 50, and 100) with peak TPS per drive shown. Also shown is the used space capacity (in green), with total raw storage capacity in blue cross hatch. Looking at the multiple metrics in context shows that the 600GB Enterprise 15K HDD with performance enhanced cache is a premium option as an alternative, or, to complement flash SSD solutions.

    database TPCC transactional workloads
    Figure-2 472GB Database TPS scaling along with cost per TPS and storage space used

    In figure-2, the 1.8TB Enterprise 10K HDD with performance enhanced cache while not as fast as the 15K, provides a good balance of performance, space capacity and cost effectiveness. A good use for the 10K drives is where some amount of performance is needed as well as a large amount of storage space for less frequently accessed content.

    A low cost, low performance option would be the 2TB Enterprise Capacity HDD’s that have a good cost per capacity, however lack the performance of the 15K and 10K drives with enhanced performance cache. A four drive RAID 10 along with a five drive software volume (Microsoft WIndows) are also shown. For apples to apples comparison look at costs vs. capacity including number of drives needed for a given level of performance.

    Figure-3 is a variation of figure-2 showing TPC-C TPS (blue bar) and response time (red-dashed line) scaling across 1, 20, 50 and 100 users. Once again the Enterprise 15K with enhanced performance cache feature enabled has good performance in an apples to apples RAID 1 comparison.

    Note that the best performance was with the four drive RAID 10 using 10K HDD’s Given popularity, a four drive RAID 10 configuration with the 10K drives was used. Not surprising the four 10K drives performed better than the RAID 1 15Ks. Also note using five drives in a software spanned volume provides a large amount of storage capacity and good performance however with a larger drive footprint.

    database TPCC transactional workloads scaling
    Figure-3 472GB Database TPS scaling along with response time (latency)

    From a cost per space capacity perspective, the Enterprise Capacity drives have a good cost per GB. A hybrid solution for environment that do not need ultra-high performance would be to pair a small amount of flash SSD (10) (drives or PCIe cards), as well as the 10K and 15K performance enhanced drives with the Enterprise Capacity HDD (11) along with cache or tiering software.

    (Note 10) Refer to Seagate 1200 12 Gbps Enterprise SAS SSD StorageIO lab review

    (Note 11) Refer to Enterprise SSHD and Flash SSD Part of an Enterprise Tiered Storage Strategy

    Where To Learn More

    Additional learning experiences along with common questions (and answers), as well as tips can be found in Software Defined Data Infrastructure Essentials book.

    Software Defined Data Infrastructure Essentials Book SDDC

    What This All Means

    If your environment is using applications that rely on databases, then test resources such as servers, storage, devices using tools that represent your environment. This means moving up the software and technology stack from basic storage I/O benchmark or workload generator tools such as Iometer among others instead using either your own application, or tools that can replay or generate various workloads that represent your environment.

    Continue reading part five in this multi-part series here where the focus shifts to large and small file I/O processing workloads.

    Ok, nuff said, for now.

    Gs

    Greg Schulz – Microsoft MVP Cloud and Data Center Management, VMware vExpert 2010-2017 (vSAN and vCloud). Author of Software Defined Data Infrastructure Essentials (CRC Press), as well as Cloud and Virtual Data Storage Networking (CRC Press), The Green and Virtual Data Center (CRC Press), Resilient Storage Networks (Elsevier) and twitter @storageio. Courteous comments are welcome for consideration. First published on https://storageioblog.com any reproduction in whole, in part, with changes to content, without source attribution under title or without permission is forbidden.

    All Comments, (C) and (TM) belong to their owners/posters, Other content (C) Copyright 2006-2024 Server StorageIO and UnlimitedIO. All Rights Reserved. StorageIO is a registered Trade Mark (TM) of Server StorageIO.

    Which Enterprise HDD for Content Applications Different File Size Impact

    Which HDD for Content Applications Different File Size Impact

    Different File Size Impact server storage I/O trends

    Updated 1/23/2018

    Which enterprise HDD to use with a content server platform different file size impact.

    Insight for effective server storage I/O decision making
    Server StorageIO Lab Review

    Which enterprise HDD to use for content servers

    This is the fifth in a multi-part series (read part four here) based on a white paper hands-on lab report I did compliments of Servers Direct and Seagate that you can read in PDF form here. The focus is looking at the Servers Direct (www.serversdirect.com) converged Content Solution platforms with Seagate Enterprise Hard Disk Drive (HDD’s). In this post the focus looks at large and small file I/O processing.

    File Performance Activity

    Tip, Content solutions use files in various ways. Use the following to gain perspective how various HDD’s handle workloads similar to your specific needs.

    Two separate file processing workloads were run (12), one with a relative small number of large files, and another with a large number of small files. For the large file processing (table-3), 5 GByte sized files were created and then accessed via 128 Kbyte (128KB) sized I/O over a 10 hour period with 90% read using 64 threads (workers). Large file workload simulates what might be seen with higher definition video, image or other content streaming.

    (Note 12) File processing workloads were run using Vdbench 5.04 and file anchors with sample script configuration below. Instead of vdbench you could also use other tools such as sysbench or fio among others.

    VdbenchFSBigTest.txt
    # Sample script for big files testing
    fsd=fsd1,anchor=H:,depth=1,width=5,files=20,size=5G
    fwd=fwd1,fsd=fsd1,rdpct=90,xfersize=128k,fileselect=random,fileio=random,threads=64
    rd=rd1,fwd=fwd1,fwdrate=max,format=yes,elapsed=10h,interval=30

    vdbench -f VdbenchFSBigTest.txt -m 16 -o Results_FSbig_H_060615

    VdbenchFSSmallTest.txt
    # Sample script for big files testing
    fsd=fsd1,anchor=H:,depth=1,width=64,files=25600,size=16k
    fwd=fwd1,fsd=fsd1,rdpct=90,xfersize=1k,fileselect=random,fileio=random,threads=64
    rd=rd1,fwd=fwd1,fwdrate=max,format=yes,elapsed=10h,interval=30

    vdbench -f VdbenchFSSmallTest.txt -m 16 -o Results_FSsmall_H_060615

    The 10% writes are intended to reflect some update activity for new content or other changes to content. Note that 128KB per second translates to roughly 1 Gbps streaming content such as higher definition video. However 4K video (not optimized) would require a higher speed as well as resulting in larger file sizes. Table-3 shows the performance during the large file access period showing average read /write rates and response time, bandwidth (MBps), average open and close rates with response time.

    Avg. File Read Rate

    Avg. Read Resp. Time
    Sec.

    Avg. File Write Rate

    Avg. Write Resp. Time
    Sec.

    Avg.
    CPU %
    Total

    Avg. CPU % System

    Avg. MBps
    Read

    Avg. MBps
    Write

    ENT 15K R1

    580.7

    107.9

    64.5

    19.7

    52.2

    35.5

    72.6

    8.1

    ENT 10K R1

    455.4

    135.5

    50.6

    44.6

    34.0

    22.7

    56.9

    6.3

    ENT CAP R1

    285.5

    221.9

    31.8

    19.0

    43.9

    28.3

    37.7

    4.0

    ENT 10K R10

    690.9

    87.21

    76.8

    48.6

    35.0

    21.8

    86.4

    9.6

    Table-3 Performance summary for large file access operations (90% read)

    Table-3 shows that for two-drive RAID 1, the Enterprise 15K are the fastest performance, however using a RAID 10 with four 10K HDD’s with enhanced cache features provide a good price, performance and space capacity option. Software RAID was used in this workload test.

    Figure-4 shows the relative performance of various HDD options handling large files, keep in mind that for the response line lower is better, while for the activity rate higher is better.

    large file processing
    Figure-4 Large file processing 90% read, 10% write rate and response time

    In figure-4 you can see the performance in terms of response time (reads larger dashed line, writes smaller dotted line) along with number of file read operations per second (reads solid blue column bar, writes green column bar). Reminder that lower response time, and higher activity rates are better. Performance declines moving from left to right, from 15K to 10K Enterprise Performance with enhanced cache feature to Enterprise Capacity (7.2K), all of which were hardware RAID 1. Also shown is a hardware RAID 10 (four x 10K HDD’s).

    Results in figure-4 above and table-4 below show how various drives can be configured to balance their performance, capacity and costs to meet different needs. Table-4 below shows an analysis looking at average file reads per second (RPS) performance vs. HDD costs, usable capacity and protection level.

    Table-4 is an example of looking at multiple metrics to make informed decisions as to which HDD would be best suited to your specific needs. For example RAID 10 using four 10K drives provides good performance and protection along with large usable space, however that also comes at a budget cost (e.g. price).

    Avg.
    File Reads Per Sec. (RPS)

    Single Drive Cost per RPS

    Multi-Drive Cost per RPS

    Single Drive Cost / Per GB Capacity

    Cost / Per GB Usable (Protected) Cap.

    Drive Cost (Multiple Drives)

    Protection Overhead (Space Capacity for RAID)

    Cost per usable GB per RPS

    Avg. File Read Resp. (Sec.)

    ENT 15K R1

    580.7

    $1.02

    $2.05

    $ 0.99

    $0.99

    $1,190

    100%

    $2.1

    107.9

    ENT 10K R1

    455.5

    1.92

    3.84

    0.49

    0.49

    1,750

    100%

    3.8

    135.5

    ENT CAP R1

    285.5

    1.40

    2.80

    0.20

    0.20

    798

    100%

    2.8

    271.9

    ENT 10K R10

    690.9

    1.27

    5.07

    0.49

    0.97

    3,500

    100%

    5.1

    87.2

    Table-4 Performance, capacity and cost analysis for big file processing

    Small File Size Processing

    To simulate a general file sharing environment, or content streaming with many smaller objects, 1,638,464 16KB sized files were created on each device being tested (table-5). These files were spread across 64 directories (25,600 files each) and accessed via 64 threads (workers) doing 90% reads with a 1KB I/O size over a ten hour time frame. Like the large file test, and database activity, all workloads were run at the same time (e.g. test devices were concurrently busy).

    Avg. File Read Rate

    Avg. Read Resp. Time
    Sec.

    Avg. File Write Rate

    Avg. Write Resp. Time
    Sec.

    Avg.
    CPU %
    Total

    Avg. CPU % System

    Avg. MBps
    Read

    Avg. MBps
    Write

    ENT 15K R1

    3,415.7

    1.5

    379.4

    132.2

    24.9

    19.5

    3.3

    0.4

    ENT 10K R1

    2,203.4

    2.9

    244.7

    172.8

    24.7

    19.3

    2.2

    0.2

    ENT CAP R1

    1,063.1

    12.7

    118.1

    303.3

    24.6

    19.2

    1.1

    0.1

    ENT 10K R10

    4,590.5

    0.7

    509.9

    101.7

    27.7

    22.1

    4.5

    0.5

    Table-5 Performance summary for small sized (16KB) file access operations (90% read)

    Figure-5 shows the relative performance of various HDD options handling large files, keep in mind that for the response line lower is better, while for the activity rate higher is better.

    small file processing
    Figure-5 Small file processing 90% read, 10% write rate and response time

    In figure-5 you can see the performance in terms of response time (reads larger dashed line, writes smaller dotted line) along with number of file read operations per second (reads solid blue column bar, writes green column bar). Reminder that lower response time, and higher activity rates are better. Performance declines moving from left to right, from 15K to 10K Enterprise Performance with enhanced cache feature to Enterprise Capacity (7.2K RPM), all of which were hardware RAID 1. Also shown is a hardware RAID 10 (four x 10K RPM HDD’s) that has higher performance and capacity along with costs (table-5).

    Results in figure-5 above and table-5 below show how various drives can be configured to balance their performance, capacity and costs to meet different needs. Table-6 below shows an analysis looking at average file reads per second (RPS) performance vs. HDD costs, usable capacity and protection level.

    Table-6 is an example of looking at multiple metrics to make informed decisions as to which HDD would be best suited to your specific needs. For example RAID 10 using four 10K drives provides good performance and protection along with large usable space, however that also comes at a budget cost (e.g. price).

    Avg.
    File Reads Per Sec. (RPS)

    Single Drive Cost per RPS

    Multi-Drive Cost per RPS

    Single Drive Cost / Per GB Capacity

    Cost / Per GB Usable (Protected) Cap.

    Drive Cost (Multiple Drives)

    Protection Overhead (Space Capacity for RAID)

    Cost per usable GB per RPS

    Avg. File Read Resp. (Sec.)

    ENT 15K R1

    3,415.7

    $0.17

    $0.35

    $0.99

    $0.99

    $1,190

    100%

    $0.35

    1.51

    ENT 10K R1

    2,203.4

    0.40

    0.79

    0.49

    0.49

    1,750

    100%

    0.79

    2.90

    ENT CAP R1

    1,063.1

    0.38

    0.75

    0.20

    0.20

    798

    100%

    0.75

    12.70

    ENT 10K R10

    4,590.5

    0.19

    0.76

    0.49

    0.97

    3,500

    100%

    0.76

    0.70

    Table-6 Performance, capacity and cost analysis for small file processing

    Looking at the small file processing analysis in table-5 shows that the 15K HDD’s on an apples to apples basis (e.g. same RAID level and number of drives) provide the best performance. However when also factoring in space capacity, performance, different RAID level or other protection schemes along with cost, there are other considerations. On the other hand the Enterprise Capacity 2TB HDD’s have a low cost per capacity, however do not have the performance of other options, assuming your applications need more performance.

    Thus the right HDD for one application may not be the best one for a different scenario as well as multiple metrics as shown in table-5 need to be included in an informed storage decision making process.

    Where To Learn More

    Additional learning experiences along with common questions (and answers), as well as tips can be found in Software Defined Data Infrastructure Essentials book.

    Software Defined Data Infrastructure Essentials Book SDDC

    What This All Means

    File processing are common content applications tasks, some being small, others large or mixed as well as reads and writes. Even if your content environment is using object storage, chances are unless it is a new applications or a gateway exists, you may be using NAS or file based access. Thus the importance of if your applications are doing file based processing, either run your own applications or use tools that can simulate as close as possible to what your environment is doing.

    Continue reading part six in this multi-part series here where the focus is around general I/O including 8KB and 128KB sized IOPs along with associated metrics.

    Ok, nuff said, for now.

    Gs

    Greg Schulz – Microsoft MVP Cloud and Data Center Management, VMware vExpert 2010-2017 (vSAN and vCloud). Author of Software Defined Data Infrastructure Essentials (CRC Press), as well as Cloud and Virtual Data Storage Networking (CRC Press), The Green and Virtual Data Center (CRC Press), Resilient Storage Networks (Elsevier) and twitter @storageio. Courteous comments are welcome for consideration. First published on https://storageioblog.com any reproduction in whole, in part, with changes to content, without source attribution under title or without permission is forbidden.

    All Comments, (C) and (TM) belong to their owners/posters, Other content (C) Copyright 2006-2024 Server StorageIO and UnlimitedIO. All Rights Reserved. StorageIO is a registered Trade Mark (TM) of Server StorageIO.

    Which Enterprise HDD for Content Applications General I/O Performance

    Which HDD for Content Applications general I/O Performance

    hdd general i/o performance server storage I/O trends

    Updated 1/23/2018

    Which enterprise HDD to use with a content server platform general I/O performance Insight for effective server storage I/O decision making
    Server StorageIO Lab Review

    Which enterprise HDD to use for content servers

    This is the sixth in a multi-part series (read part five here) based on a white paper hands-on lab report I did compliments of Servers Direct and Seagate that you can read in PDF form here. The focus is looking at the Servers Direct (www.serversdirect.com) converged Content Solution platforms with Seagate Enterprise Hard Disk Drive (HDD’s). In this post the focus is around general I/O performance including 8KB and 128KB IOP sizes.

    General I/O Performance

    In addition to running database and file (large and small) processing workloads, Vdbench was also used to collect basic small (8KB) and large (128KB) sized I/O operations. This consisted of random and sequential reads as well as writes with the results shown below. In addition to using vdbench, other tools that could be used include Microsoft Diskspd, fio, iorate and iometer among many others.

    These workloads used Vdbench configured (13) to do direct I/O to a Windows file system mounted device using as much of the available disk space as possible. All workloads used 16 threads and were run concurrently similar to database and file processing tests.

    (Note 13) Sample vdbench configuration for general I/O, note different settings were used for various tests

    Table-7 shows workload results for 8KB random IOPs 75% reads and 75% writes including IOPs, bandwidth and response time.


    ENT 15K RAID1

    ENT 10K RAID1

    ENT CAP RAID1

    ENT 10K R10
    (4 Drives)

    ECAP SW RAID (5 Drives)


    75% Read

    25% Read

    75% Read

    25% Read

    75% Read

    25% Read

    75% Read

    25% Read

    75% Read

    25% Read

    I/O Rate (IOPs)

    597.11

    559.26

    514

    475

    285

    293

    979

    984

    491

    644

    MB/sec

    4.7

    4.4

    4.0

    3.7

    2.2

    2.3

    7.7

    7.7

    3.8

    5.0

    Resp. Time (Sec.)

    25.9

    27.6

    30.2

    32.7

    55.5

    53.7

    16.3

    16.3

    32.6

    24.8

    Table-7 8KB sized random IOPs workload results

    Figure-6 shows small (8KB) random I/O (75% read and 25% read) across different HDD configurations. Performance including activity rates (e.g. IOPs), bandwidth and response time for mixed reads / writes are shown. Note how response time increases with the Enterprise Capacity configurations vs. other performance optimized drives.

    general 8K random IO
    Figure-6 8KB random reads and write showing IOP activity, bandwidth and response time

    Table-8 below shows workload results for 8GB sized I/Os 100% sequential with 75% reads and 75% writes including IOPs, MB/sec and response time in seconds.

    ENT 15K RAID1

    ENT 10K RAID1

    ENT CAP RAID1

    ENT 10K R10
    (4 Drives)

    ECAP SW RAID (5 Drives)

    75% Read

    25% Read

    75% Read

    25% Read

    75% Read

    25% Read

    75% Read

    25% Read

    75% Read

    25% Read

    I/O Rate (IOPs)

    3,778

    3,414

    3,761

    3,986

    3,379

    1,274

    11,840

    8,368

    2,891

    1,146

    MB/sec

    29.5

    26.7

    29.4

    31.1

    26.4

    10.0

    92.5

    65.4

    22.6

    9.0

    Resp. Time (Sec.)

    2.2

    3.1

    2.3

    2.4

    2.7

    10.9

    1.3

    1.9

    5.5

    14.0

    Table-8 8KB sized sequential workload results

    Figure-7 shows small 8KB sequential mixed reads and writes (75% read and 75% write), while the Enterprise Capacity 2TB HDD has a large amount of space capacity, its performance in a RAID 1 vs. other similar configured drives is slower.

    8KB Sequential
    Figure-7 8KB sequential 75% reads and 75% write showing bandwidth activity

    Table-9 shows workload results for 100% sequential, 100% read and 100% write 128KB sized I/Os including IOPs, bandwidth and response time.

    ENT 15K RAID1

    ENT 10K RAID1

    ENT CAP RAID1

    ENT 10K R10
    (4 Drives)

    ECAP SW RAID (5 Drives)

    Read

    Write

    Read

    Write

    Read

    Write

    Read

    Write

    Read

    Write

    I/O Rate (IOPs)

    1,798

    1,771

    1,716

    1,688

    921

    912

    3,552

    3,486

    780

    721

    MB/sec

    224.7

    221.3

    214.5

    210.9

    115.2

    114.0

    444.0

    435.8

    97.4

    90.1

    Resp. Time (Sec.)

    8.9

    9.0

    9.3

    9.5

    17.4

    17.5

    4.5

    4.6

    19.3

    20.2

    Table-9 128KB sized sequential workload results

    Figure-8 shows sequential or streaming operations of larger I/O (100% read and 100% write) requests sizes (128KB) that would be found with large content applications. Figure-8 highlights the relationship between lower response time and increased IOPs as well as bandwidth.

    128K Sequential
    Figure-8 128KB sequential reads and write showing IOP activity, bandwidth and response time

    Where To Learn More

    Additional learning experiences along with common questions (and answers), as well as tips can be found in Software Defined Data Infrastructure Essentials book.

    Software Defined Data Infrastructure Essentials Book SDDC

    What This All Means

    Some content applications are doing small random I/Os for database, key value stores or repositories as well as meta data processing while others are doing large sequential I/O. 128KB sized I/O may be large for your environment, on the other hand, with an increasing number of applications, file systems, software defined storage management tools among others, 1 to 10MB or even larger I/O sizes are becoming common. Key is selecting I/O sizes and read write as well as random sequential along with I/O or queue depths that align with your environment.

    Continue reading part seven the final post in this multi-part series here where the focus is around how HDD’s continue to evolve including performance beyond traditional RPM based execrations along with wrap up.

    Ok, nuff said, for now.

    Gs

    Greg Schulz – Microsoft MVP Cloud and Data Center Management, VMware vExpert 2010-2017 (vSAN and vCloud). Author of Software Defined Data Infrastructure Essentials (CRC Press), as well as Cloud and Virtual Data Storage Networking (CRC Press), The Green and Virtual Data Center (CRC Press), Resilient Storage Networks (Elsevier) and twitter @storageio. Courteous comments are welcome for consideration. First published on https://storageioblog.com any reproduction in whole, in part, with changes to content, without source attribution under title or without permission is forbidden.

    All Comments, (C) and (TM) belong to their owners/posters, Other content (C) Copyright 2006-2024 Server StorageIO and UnlimitedIO. All Rights Reserved. StorageIO is a registered Trade Mark (TM) of Server StorageIO.