ROI From Use Of Global Control Plane For Expanding VDI Environments

ROI From Use Of Global Control Plane For Cloud VDI Environments

ROI From Use Of Global Control Plane For Expanding VDI Environments

The following is a new Industry Trends Perspective White Paper Report titled ROI From Use Of Global Control Plane For Expanding VDI Environments.

ROI From Use Of Global Control Plane For Expanding VDI Environments

This new StorageIO report looks at ROI From Use Of Global Control Plane For Expanding VDI environments. Using a Pro-Forma analysis this report provides a financial economic model comparison with Return on Investment (ROI) cost savings analysis for managing cloud based virtual desktop infrastructures (VDI) environments.

Cloud File Data Storage Consolidation and Economic Comparison Model

IT data infrastructure resource (servers, storage, I/O network, hardware, software, services) decision-making involves evaluating and comparing technical attributes (speeds, feeds, features) of a solution or service. Another aspect of data infrastructure resource decision-making involves assessing how a solution or service will support and enable a given application workload, along with associated management costs from a Performance, Availability, Capacity, and Economic (PACE) perspective.

Keep in mind that all application workloads have some amount of PACE resource requirements that may be high, low or various permutations, along with associated management costs. Performance, Availability (including data protection along with security) as well as Capacity are addressed via technical speeds, feeds, functionality along with workload suitability analysis.

Management costs are a function of initial and recurring tasks to support a given function or service such as VDI. The cost of management includes staff salary, along with amount of time needed to perform various tasks. The E in PACE resource decision-making is about the Economic analysis of various costs associated with different solution approaches.

ROI From Use Of Global Control Plane For Expanding VDI Environments

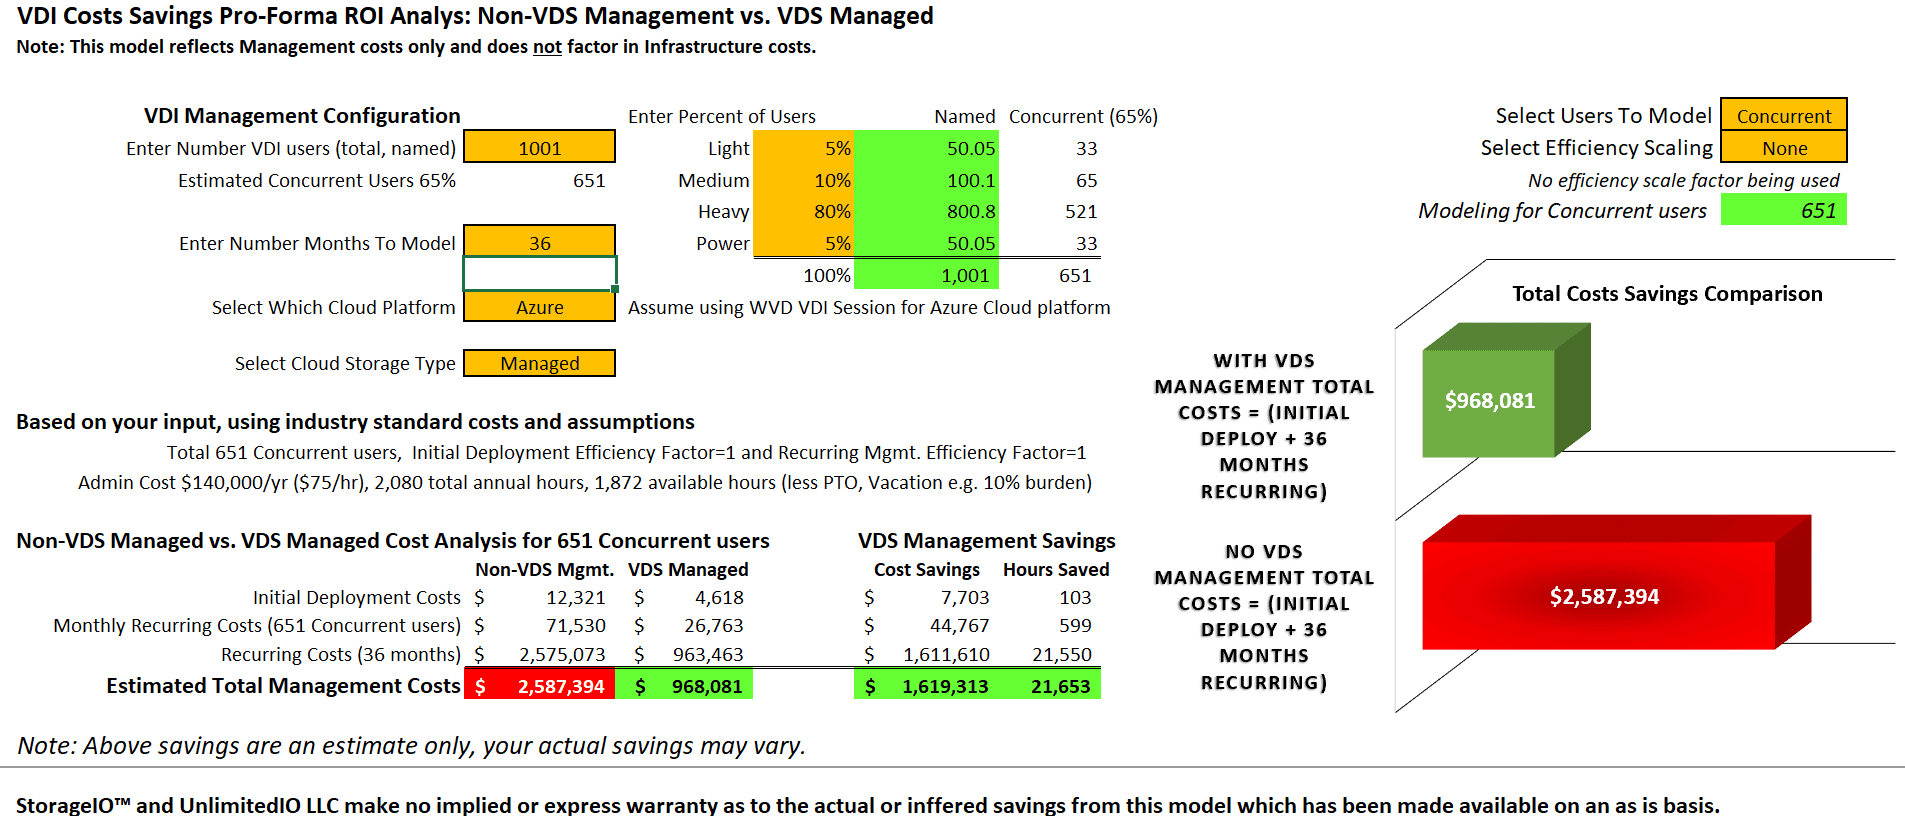
The above image is an example from the White Paper Report titled ROI From Use Of Global Control Plane For Expanding VDI Environments.

In the example shown above, 36 month OpEx cost (and time) savings are shown using traditional cloud based VDI management tools, technologies and techniques vs. a modern cloud platform integrated global control plane solution. Leveraging a cloud platform integrated global control plane solution such as NetApp VDS among others, management costs can be reduced for initial and recurring tasks from $2,587,394 to $968,041 for 1,001 users.

In addition to the cost savings shown above, note the reduction in management hours of 21,653 over 36 months which could be used for doing other work, or reducing your OpEx spend. Of course your savings will vary based on what tasks, time per task, admin cost among other considerations.

The shift from Capital Expenditures (e.g. CapEx) IT data infrastructure spending to Operational Expenditures (e.g. OpEx) focus particular with IT clouds has resulted in increased OpEx budget demands. Increased spending is more than simply moving IT spend from the CapEx to OpEx columns in budgets. OpEx increases are a cumulation of increased cloud services and data infrastructure spend, along with management (initial and recurring) costs.

The good news is that there are OpEx opportunities to reduce, or, stretch your IT budget to do more while boosting productivity, performance, and effectiveness without compromise. By looking at how to use new technologies in new ways, including leverage cloud platform integrated global control planes for management of VDI (and other functions), initial and recurring OpEx management costs can be reduced.

Read more in this Server StorageIO Industry Trends  Report here.

Where to learn more

Learn more about ROI From Use Of Global Control Plane For Expanding VDI Environments, Clouds and Data Infrastructure related trends, tools, technologies and topics via the following links:

Application Data Value Characteristics Everything Is Not the Same
PACE your Infrastructure decision-making, it’s about application requirements
Cloud conversations: confidence, certainty, and confidentiality
Industry adoption vs. industry deployment, is there a difference?
Ten tips to reduce your cloud compute storage costs 
Don’t Stop Learning Expand Your Skills Experiences Everyday 
ToE NVMeoF TCP Performance Reduce Costs
Data Infrastructure Server Storage I/O Tradecraft Trends
Data Infrastructure Overview, Its What’s Inside of Data Centers
Data Infrastructure Management (Insight and Strategies)
Data Protection Diaries (Archive, Backup, BC, BR, DR, HA, Security)
NetApp VDS with Global Control Plane Cloud VDI Management

Additional learning experiences along with common questions (and answers), as well as tips can be found in Software Defined Data Infrastructure Essentials book.

Software Defined Data Infrastructure Essentials Book SDDC

What this all means

In addition, looking at your IT data infrastructure cloud spend can also help you to boost the effectiveness, productivity and return on investment while reducing your OpEx spend, or doing more with it. Leveraging financial pro-forma analysis as a tool in conjunction with your technology feature function, speeds, feeds comparisons enables informed decision making.

When comparing and making data infrastructure resource decisions, consider the application workload PACE characteristics. Shift or expand your focus from simply looking at costs from a efficiency utilization perspective to also include performance, productivity, and effectiveness of your IT OpEx spending.

Keep in mind that PACE means Performance (productivity), Availability (data protection), Capacity and Economics. This includes making decisions from a technical feature, functionality (speeds and feeds) capacity as well as how the solution supports your application workload. Leverage resources including tools to perform analysis including ROI From Use Of Global Control Plane For Expanding VDI Environments approaches.

Ok, nuff said, for now.

Cheers GS

Greg Schulz – Microsoft MVP Cloud and Data Center Management, previous 10 time VMware vExpert. Author of Software Defined Data Infrastructure Essentials (CRC Press), Data Infrastructure Management (CRC Press), as well as Cloud and Virtual Data Storage Networking (CRC Press), The Green and Virtual Data Center (CRC Press), Resilient Storage Networks (Elsevier) and twitter @storageio. Courteous comments are welcome for consideration. First published on https://storageioblog.com any reproduction in whole, in part, with changes to content, without source attribution under title or without permission is forbidden.

All Comments, (C) and (TM) belong to their owners/posters, Other content (C) Copyright 2006-2024 Server StorageIO and UnlimitedIO. All Rights Reserved. StorageIO is a registered Trade Mark (TM) of Server StorageIO.

Which Enterprise HDD for Content Applications General I/O Performance

Which HDD for Content Applications general I/O Performance

hdd general i/o performance server storage I/O trends

Updated 1/23/2018

Which enterprise HDD to use with a content server platform general I/O performance Insight for effective server storage I/O decision making
Server StorageIO Lab Review

Which enterprise HDD to use for content servers

This is the sixth in a multi-part series (read part five here) based on a white paper hands-on lab report I did compliments of Servers Direct and Seagate that you can read in PDF form here. The focus is looking at the Servers Direct (www.serversdirect.com) converged Content Solution platforms with Seagate Enterprise Hard Disk Drive (HDD’s). In this post the focus is around general I/O performance including 8KB and 128KB IOP sizes.

General I/O Performance

In addition to running database and file (large and small) processing workloads, Vdbench was also used to collect basic small (8KB) and large (128KB) sized I/O operations. This consisted of random and sequential reads as well as writes with the results shown below. In addition to using vdbench, other tools that could be used include Microsoft Diskspd, fio, iorate and iometer among many others.

These workloads used Vdbench configured (13) to do direct I/O to a Windows file system mounted device using as much of the available disk space as possible. All workloads used 16 threads and were run concurrently similar to database and file processing tests.

(Note 13) Sample vdbench configuration for general I/O, note different settings were used for various tests

Table-7 shows workload results for 8KB random IOPs 75% reads and 75% writes including IOPs, bandwidth and response time.


ENT 15K RAID1

ENT 10K RAID1

ENT CAP RAID1

ENT 10K R10
(4 Drives)

ECAP SW RAID (5 Drives)


75% Read

25% Read

75% Read

25% Read

75% Read

25% Read

75% Read

25% Read

75% Read

25% Read

I/O Rate (IOPs)

597.11

559.26

514

475

285

293

979

984

491

644

MB/sec

4.7

4.4

4.0

3.7

2.2

2.3

7.7

7.7

3.8

5.0

Resp. Time (Sec.)

25.9

27.6

30.2

32.7

55.5

53.7

16.3

16.3

32.6

24.8

Table-7 8KB sized random IOPs workload results

Figure-6 shows small (8KB) random I/O (75% read and 25% read) across different HDD configurations. Performance including activity rates (e.g. IOPs), bandwidth and response time for mixed reads / writes are shown. Note how response time increases with the Enterprise Capacity configurations vs. other performance optimized drives.

general 8K random IO
Figure-6 8KB random reads and write showing IOP activity, bandwidth and response time

Table-8 below shows workload results for 8GB sized I/Os 100% sequential with 75% reads and 75% writes including IOPs, MB/sec and response time in seconds.

ENT 15K RAID1

ENT 10K RAID1

ENT CAP RAID1

ENT 10K R10
(4 Drives)

ECAP SW RAID (5 Drives)

75% Read

25% Read

75% Read

25% Read

75% Read

25% Read

75% Read

25% Read

75% Read

25% Read

I/O Rate (IOPs)

3,778

3,414

3,761

3,986

3,379

1,274

11,840

8,368

2,891

1,146

MB/sec

29.5

26.7

29.4

31.1

26.4

10.0

92.5

65.4

22.6

9.0

Resp. Time (Sec.)

2.2

3.1

2.3

2.4

2.7

10.9

1.3

1.9

5.5

14.0

Table-8 8KB sized sequential workload results

Figure-7 shows small 8KB sequential mixed reads and writes (75% read and 75% write), while the Enterprise Capacity 2TB HDD has a large amount of space capacity, its performance in a RAID 1 vs. other similar configured drives is slower.

8KB Sequential
Figure-7 8KB sequential 75% reads and 75% write showing bandwidth activity

Table-9 shows workload results for 100% sequential, 100% read and 100% write 128KB sized I/Os including IOPs, bandwidth and response time.

ENT 15K RAID1

ENT 10K RAID1

ENT CAP RAID1

ENT 10K R10
(4 Drives)

ECAP SW RAID (5 Drives)

Read

Write

Read

Write

Read

Write

Read

Write

Read

Write

I/O Rate (IOPs)

1,798

1,771

1,716

1,688

921

912

3,552

3,486

780

721

MB/sec

224.7

221.3

214.5

210.9

115.2

114.0

444.0

435.8

97.4

90.1

Resp. Time (Sec.)

8.9

9.0

9.3

9.5

17.4

17.5

4.5

4.6

19.3

20.2

Table-9 128KB sized sequential workload results

Figure-8 shows sequential or streaming operations of larger I/O (100% read and 100% write) requests sizes (128KB) that would be found with large content applications. Figure-8 highlights the relationship between lower response time and increased IOPs as well as bandwidth.

128K Sequential
Figure-8 128KB sequential reads and write showing IOP activity, bandwidth and response time

Where To Learn More

Additional learning experiences along with common questions (and answers), as well as tips can be found in Software Defined Data Infrastructure Essentials book.

Software Defined Data Infrastructure Essentials Book SDDC

What This All Means

Some content applications are doing small random I/Os for database, key value stores or repositories as well as meta data processing while others are doing large sequential I/O. 128KB sized I/O may be large for your environment, on the other hand, with an increasing number of applications, file systems, software defined storage management tools among others, 1 to 10MB or even larger I/O sizes are becoming common. Key is selecting I/O sizes and read write as well as random sequential along with I/O or queue depths that align with your environment.

Continue reading part seven the final post in this multi-part series here where the focus is around how HDD’s continue to evolve including performance beyond traditional RPM based execrations along with wrap up.

Ok, nuff said, for now.

Gs

Greg Schulz – Microsoft MVP Cloud and Data Center Management, VMware vExpert 2010-2017 (vSAN and vCloud). Author of Software Defined Data Infrastructure Essentials (CRC Press), as well as Cloud and Virtual Data Storage Networking (CRC Press), The Green and Virtual Data Center (CRC Press), Resilient Storage Networks (Elsevier) and twitter @storageio. Courteous comments are welcome for consideration. First published on https://storageioblog.com any reproduction in whole, in part, with changes to content, without source attribution under title or without permission is forbidden.

All Comments, (C) and (TM) belong to their owners/posters, Other content (C) Copyright 2006-2024 Server StorageIO and UnlimitedIO. All Rights Reserved. StorageIO is a registered Trade Mark (TM) of Server StorageIO.

Big Files Lots of Little File Processing Benchmarking with Vdbench

Big Files Lots of Little File Processing Benchmarking with Vdbench


server storage data infrastructure i/o File Processing Benchmarking with Vdbench

Updated 2/10/2018

Need to test a server, storage I/O networking, hardware, software, services, cloud, virtual, physical or other environment that is either doing some form of file processing, or, that you simply want to have some extra workload running in the background for what ever reason? An option is File Processing Benchmarking with Vdbench.

I/O performance

Getting Started


Here’s a quick and relatively easy way to do it with Vdbench (Free from Oracle). Granted there are other tools, both for free and for fee that can similar things, however we will leave those for another day and post. Here’s the con to this approach, there is no Uui Gui like what you have available with some other tools Here’s the pro to this approach, its free, flexible and limited by your creative, amount of storage space, server memory and I/O capacity.

If you need a background on Vdbench and benchmarking, check out the series of related posts here (e.g. www.storageio.com/performance).

Get and Install the Vdbench Bits and Bytes


If you do not already have Vdbench installed, get a copy from the Oracle or Source Forge site (now points to Oracle here).

Vdbench is free, you simply sign-up and accept the free license, select the version down load (it is a single, common distribution for all OS) the bits as well as documentation.

Installation particular on Windows is really easy, basically follow the instructions in the documentation by copying the contents of the download folder to a specified directory, set up any environment variables, and make sure that you have Java installed.

Here is a hint and tip for Windows Servers, if you get an error message about counters, open a command prompt with Administrator rights, and type the command:

$ lodctr /r


The above command will reset your I/O counters. Note however that command will also overwrite counters if enabled so only use it if you have to.

Likewise *nix install is also easy, copy the files, make sure to copy the applicable *nix shell script (they are in the download folder), and verify Java is installed and working.

You can do a vdbench -t (windows) or ./vdbench -t (*nix) to verify that it is working.

Vdbench File Processing

There are many options with Vdbench as it has a very robust command and scripting language including ability to set up for loops among other things. We are only going to touch the surface here using its file processing capabilities. Likewise, Vdbench can run from a single server accessing multiple storage systems or file systems, as well as running from multiple servers to a single file system. For simplicity, we will stick with the basics in the following examples to exercise a local file system. The limits on the number of files and file size are limited by server memory and storage space.

You can specify number and depth of directories to put files into for processing. One of the parameters is the anchor point for the file processing, in the following examples =S:\SIOTEMP\FS1 is used as the anchor point. Other parameters include the I/O size, percent reads, number of threads, run time and sample interval as well as output folder name for the result files. Note that unlike some tools, Vdbench does not create a single file of results, rather a folder with several files including summary, totals, parameters, histograms, CSV among others.


Simple Vdbench File Processing Commands

For flexibility and ease of use I put the following three Vdbench commands into a simple text file that is then called with parameters on the command line.
fsd=fsd1,anchor=!fanchor,depth=!dirdep,width=!dirwid,files=!numfiles,size=!filesize

fwd=fwd1,fsd=fsd1,rdpct=!filrdpct,xfersize=!fxfersize,fileselect=random,fileio=random,threads=!thrds

rd=rd1,fwd=fwd1,fwdrate=max,format=yes,elapsed=!etime,interval=!itime

Simple Vdbench script

# SIO_vdbench_filesystest.txt
#
# Example Vdbench script for file processing
#
# fanchor = file system place where directories and files will be created
# dirwid = how wide should the directories be (e.g. how many directories wide)
# numfiles = how many files per directory
# filesize = size in in k, m, g e.g. 16k = 16KBytes
# fxfersize = file I/O transfer size in kbytes
# thrds = how many threads or workers
# etime = how long to run in minutes (m) or hours (h)
# itime = interval sample time e.g. 30 seconds
# dirdep = how deep the directory tree
# filrdpct = percent of reads e.g. 90 = 90 percent reads
# -p processnumber = optional specify a process number, only needed if running multiple vdbenchs at same time, number should be unique
# -o output file that describes what being done and some config info
#
# Sample command line shown for Windows, for *nix add ./
#
# The real Vdbench script with command line parameters indicated by !=
#

fsd=fsd1,anchor=!fanchor,depth=!dirdep,width=!dirwid,files=!numfiles,size=!filesize

fwd=fwd1,fsd=fsd1,rdpct=!filrdpct,xfersize=!fxfersize,fileselect=random,fileio=random,threads=!thrds

rd=rd1,fwd=fwd1,fwdrate=max,format=yes,elapsed=!etime,interval=!itime

Big Files Processing Script


With the above script file defined, for Big Files I specify a command line such as the following.
$ vdbench -f SIO_vdbench_filesystest.txt fanchor=S:\SIOTemp\FS1 dirwid=1 numfiles=60 filesize=5G fxfersize=128k thrds=64 etime=10h itime=30 numdir=1 dirdep=1 filrdpct=90 -p 5576 -o SIOWS2012R220_NOFUZE_5Gx60_BigFiles_64TH_STX1200_020116

Big Files Processing Example Results


The following is one of the result files from the folder of results created via the above command for Big File processing showing totals.


Run totals

21:09:36.001 Starting RD=format_for_rd1

Feb 01, 2016 .Interval. .ReqstdOps.. ...cpu%... read ....read.... ...write.... ..mb/sec... mb/sec .xfer.. ...mkdir... ...rmdir... ..create... ...open.... ...close... ..delete...
rate resp total sys pct rate resp rate resp read write total size rate resp rate resp rate resp rate resp rate resp rate resp
21:23:34.101 avg_2-28 2848.2 2.70 8.8 8.32 0.0 0.0 0.00 2848.2 2.70 0.00 356.0 356.02 131071 0.0 0.00 0.0 0.00 0.1 109176 0.1 0.55 0.1 2006 0.0 0.00

21:23:35.009 Starting RD=rd1; elapsed=36000; fwdrate=max. For loops: None

07:23:35.000 avg_2-1200 4939.5 1.62 18.5 17.3 90.0 4445.8 1.79 493.7 0.07 555.7 61.72 617.44 131071 0.0 0.00 0.0 0.00 0.0 0.00 0.1 0.03 0.1 2.95 0.0 0.00


Lots of Little Files Processing Script


For lots of little files, the following is used.


$ vdbench -f SIO_vdbench_filesystest.txt fanchor=S:\SIOTEMP\FS1 dirwid=64 numfiles=25600 filesize=16k fxfersize=1k thrds=64 etime=10h itime=30 dirdep=1 filrdpct=90 -p 5576 -o SIOWS2012R220_NOFUZE_SmallFiles_64TH_STX1200_020116

Lots of Little Files Processing Example Results


The following is one of the result files from the folder of results created via the above command for Big File processing showing totals.
Run totals

09:17:38.001 Starting RD=format_for_rd1

Feb 02, 2016 .Interval. .ReqstdOps.. ...cpu%... read ....read.... ...write.... ..mb/sec... mb/sec .xfer.. ...mkdir... ...rmdir... ..create... ...open.... ...close... ..delete...
rate resp total sys pct rate resp rate resp read write total size rate resp rate resp rate resp rate resp rate resp rate resp
09:19:48.016 avg_2-5 10138 0.14 75.7 64.6 0.0 0.0 0.00 10138 0.14 0.00 158.4 158.42 16384 0.0 0.00 0.0 0.00 10138 0.65 10138 0.43 10138 0.05 0.0 0.00

09:19:49.000 Starting RD=rd1; elapsed=36000; fwdrate=max. For loops: None

19:19:49.001 avg_2-1200 113049 0.41 67.0 55.0 90.0 101747 0.19 11302 2.42 99.36 11.04 110.40 1023 0.0 0.00 0.0 0.00 0.0 0.00 7065 0.85 7065 1.60 0.0 0.00


Where To Learn More

View additional NAS, NVMe, SSD, NVM, SCM, Data Infrastructure and HDD related topics via the following links.

Additional learning experiences along with common questions (and answers), as well as tips can be found in Software Defined Data Infrastructure Essentials book.

Software Defined Data Infrastructure Essentials Book SDDC

What This All Means

The above examples can easily be modified to do different things particular if you read the Vdbench documentation on how to setup multi-host, multi-storage system, multiple job streams to do different types of processing. This means you can benchmark a storage systems, server or converged and hyper-converged platform, or simply put a workload on it as part of other testing. There are even options for handling data footprint reduction such as compression and dedupe.

Ok, nuff said, for now.

Gs

Greg Schulz - Microsoft MVP Cloud and Data Center Management, VMware vExpert 2010-2017 (vSAN and vCloud). Author of Software Defined Data Infrastructure Essentials (CRC Press), as well as Cloud and Virtual Data Storage Networking (CRC Press), The Green and Virtual Data Center (CRC Press), Resilient Storage Networks (Elsevier) and twitter @storageio. Courteous comments are welcome for consideration. First published on https://storageioblog.com any reproduction in whole, in part, with changes to content, without source attribution under title or without permission is forbidden.

All Comments, (C) and (TM) belong to their owners/posters, Other content (C) Copyright 2006-2024 Server StorageIO and UnlimitedIO. All Rights Reserved. StorageIO is a registered Trade Mark (TM) of Server StorageIO.