Which Enterprise HDD for Content Applications General I/O Performance

Which HDD for Content Applications general I/O Performance

hdd general i/o performance server storage I/O trends

Updated 1/23/2018

Which enterprise HDD to use with a content server platform general I/O performance Insight for effective server storage I/O decision making
Server StorageIO Lab Review

Which enterprise HDD to use for content servers

This is the sixth in a multi-part series (read part five here) based on a white paper hands-on lab report I did compliments of Servers Direct and Seagate that you can read in PDF form here. The focus is looking at the Servers Direct (www.serversdirect.com) converged Content Solution platforms with Seagate Enterprise Hard Disk Drive (HDD’s). In this post the focus is around general I/O performance including 8KB and 128KB IOP sizes.

General I/O Performance

In addition to running database and file (large and small) processing workloads, Vdbench was also used to collect basic small (8KB) and large (128KB) sized I/O operations. This consisted of random and sequential reads as well as writes with the results shown below. In addition to using vdbench, other tools that could be used include Microsoft Diskspd, fio, iorate and iometer among many others.

These workloads used Vdbench configured (13) to do direct I/O to a Windows file system mounted device using as much of the available disk space as possible. All workloads used 16 threads and were run concurrently similar to database and file processing tests.

(Note 13) Sample vdbench configuration for general I/O, note different settings were used for various tests

Table-7 shows workload results for 8KB random IOPs 75% reads and 75% writes including IOPs, bandwidth and response time.


ENT 15K RAID1

ENT 10K RAID1

ENT CAP RAID1

ENT 10K R10
(4 Drives)

ECAP SW RAID (5 Drives)


75% Read

25% Read

75% Read

25% Read

75% Read

25% Read

75% Read

25% Read

75% Read

25% Read

I/O Rate (IOPs)

597.11

559.26

514

475

285

293

979

984

491

644

MB/sec

4.7

4.4

4.0

3.7

2.2

2.3

7.7

7.7

3.8

5.0

Resp. Time (Sec.)

25.9

27.6

30.2

32.7

55.5

53.7

16.3

16.3

32.6

24.8

Table-7 8KB sized random IOPs workload results

Figure-6 shows small (8KB) random I/O (75% read and 25% read) across different HDD configurations. Performance including activity rates (e.g. IOPs), bandwidth and response time for mixed reads / writes are shown. Note how response time increases with the Enterprise Capacity configurations vs. other performance optimized drives.

general 8K random IO
Figure-6 8KB random reads and write showing IOP activity, bandwidth and response time

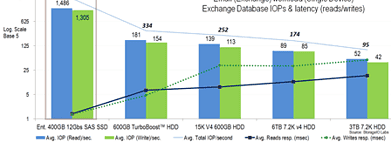
Table-8 below shows workload results for 8GB sized I/Os 100% sequential with 75% reads and 75% writes including IOPs, MB/sec and response time in seconds.

ENT 15K RAID1

ENT 10K RAID1

ENT CAP RAID1

ENT 10K R10
(4 Drives)

ECAP SW RAID (5 Drives)

75% Read

25% Read

75% Read

25% Read

75% Read

25% Read

75% Read

25% Read

75% Read

25% Read

I/O Rate (IOPs)

3,778

3,414

3,761

3,986

3,379

1,274

11,840

8,368

2,891

1,146

MB/sec

29.5

26.7

29.4

31.1

26.4

10.0

92.5

65.4

22.6

9.0

Resp. Time (Sec.)

2.2

3.1

2.3

2.4

2.7

10.9

1.3

1.9

5.5

14.0

Table-8 8KB sized sequential workload results

Figure-7 shows small 8KB sequential mixed reads and writes (75% read and 75% write), while the Enterprise Capacity 2TB HDD has a large amount of space capacity, its performance in a RAID 1 vs. other similar configured drives is slower.

8KB Sequential
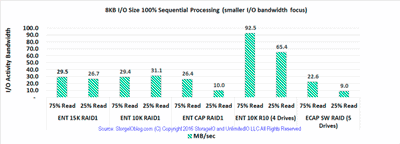
Figure-7 8KB sequential 75% reads and 75% write showing bandwidth activity

Table-9 shows workload results for 100% sequential, 100% read and 100% write 128KB sized I/Os including IOPs, bandwidth and response time.

ENT 15K RAID1

ENT 10K RAID1

ENT CAP RAID1

ENT 10K R10
(4 Drives)

ECAP SW RAID (5 Drives)

Read

Write

Read

Write

Read

Write

Read

Write

Read

Write

I/O Rate (IOPs)

1,798

1,771

1,716

1,688

921

912

3,552

3,486

780

721

MB/sec

224.7

221.3

214.5

210.9

115.2

114.0

444.0

435.8

97.4

90.1

Resp. Time (Sec.)

8.9

9.0

9.3

9.5

17.4

17.5

4.5

4.6

19.3

20.2

Table-9 128KB sized sequential workload results

Figure-8 shows sequential or streaming operations of larger I/O (100% read and 100% write) requests sizes (128KB) that would be found with large content applications. Figure-8 highlights the relationship between lower response time and increased IOPs as well as bandwidth.

128K Sequential
Figure-8 128KB sequential reads and write showing IOP activity, bandwidth and response time

Where To Learn More

Additional learning experiences along with common questions (and answers), as well as tips can be found in Software Defined Data Infrastructure Essentials book.

Software Defined Data Infrastructure Essentials Book SDDC

What This All Means

Some content applications are doing small random I/Os for database, key value stores or repositories as well as meta data processing while others are doing large sequential I/O. 128KB sized I/O may be large for your environment, on the other hand, with an increasing number of applications, file systems, software defined storage management tools among others, 1 to 10MB or even larger I/O sizes are becoming common. Key is selecting I/O sizes and read write as well as random sequential along with I/O or queue depths that align with your environment.

Continue reading part seven the final post in this multi-part series here where the focus is around how HDD’s continue to evolve including performance beyond traditional RPM based execrations along with wrap up.

Ok, nuff said, for now.

Gs

Greg Schulz – Microsoft MVP Cloud and Data Center Management, VMware vExpert 2010-2017 (vSAN and vCloud). Author of Software Defined Data Infrastructure Essentials (CRC Press), as well as Cloud and Virtual Data Storage Networking (CRC Press), The Green and Virtual Data Center (CRC Press), Resilient Storage Networks (Elsevier) and twitter @storageio. Courteous comments are welcome for consideration. First published on https://storageioblog.com any reproduction in whole, in part, with changes to content, without source attribution under title or without permission is forbidden.

All Comments, (C) and (TM) belong to their owners/posters, Other content (C) Copyright 2006-2024 Server StorageIO and UnlimitedIO. All Rights Reserved. StorageIO is a registered Trade Mark (TM) of Server StorageIO.

Server Storage I/O Benchmark Performance Resource Tools

Server Storage I/O Benchmarking Performance Resource Tools

server storage I/O trends

Updated 1/23/2018

Server storage I/O benchmark performance resource tools, various articles and tips. These include tools for legacy, virtual, cloud and software defined environments.

benchmark performance resource tools server storage I/O performance

The best server and storage I/O (input/output operation) is the one that you do not have to do, the second best is the one with the least impact.

server storage I/O locality of reference

This is where the idea of locality of reference (e.g. how close is the data to where your application is running) comes into play which is implemented via tiered memory, storage and caching shown in the figure above.

Cloud virtual software defined storage I/O

Server storage I/O performance applies to cloud, virtual, software defined and legacy environments

What this has to do with server storage I/O (and networking) performance benchmarking is keeping the idea of locality of reference, context and the application workload in perspective regardless of if cloud, virtual, software defined or legacy physical environments.

StorageIOblog: I/O, I/O how well do you know about good or bad server and storage I/Os?
StorageIOblog: Server and Storage I/O benchmarking 101 for smarties
StorageIOblog: Which Enterprise HDDs to use for a Content Server Platform (7 part series with using benchmark tools)
StorageIO.com: Enmotus FuzeDrive MicroTiering lab test using various tools
StorageIOblog: Some server storage I/O benchmark tools, workload scripts and examples (Part I) and (Part II)
StorageIOblog: Get in the NVMe SSD game (if you are not already)
Doridmen.com: Transcend SSD360S Review with tips on using ATTO and Crystal benchmark tools
ComputerWeekly: Storage performance metrics: How suppliers spin performance specifications

Via StorageIO Podcast: Kevin Closson discusses SLOB Server CPU I/O Database Performance benchmarks
Via @KevinClosson: SLOB Use Cases By Industry Vendors. Learn SLOB, Speak The Experts’ Language
Via BeyondTheBlocks (Reduxio): 8 Useful Tools for Storage I/O Benchmarking
Via CCSIObench: Cold-cache Sequential I/O Benchmark
Doridmen.com: Transcend SSD360S Review with tips on using ATTO and Crystal benchmark tools
CISJournal: Benchmarking the Performance of Microsoft Hyper-V server, VMware ESXi and Xen Hypervisors (PDF)
Microsoft TechNet:Windows Server 2016 Hyper-V large-scale VM performance for in-memory transaction processing
InfoStor: What’s The Best Storage Benchmark?
StorageIOblog: How to test your HDD, SSD or all flash array (AFA) storage fundamentals
Via ATTO: Atto V3.05 free storage test tool available
Via StorageIOblog: Big Files and Lots of Little File Processing and Benchmarking with Vdbench

Via StorageIO.com: Which Enterprise Hard Disk Drives (HDDs) to use with a Content Server Platform (White Paper)
Via VMware Blogs: A Free Storage Performance Testing Tool For Hyperconverged
Microsoft Technet: Test Storage Spaces Performance Using Synthetic Workloads in Windows Server
Microsoft Technet: Microsoft Windows Server Storage Spaces – Designing for Performance
BizTech: 4 Ways to Performance-Test Your New HDD or SSD
EnterpriseStorageForum: Data Storage Benchmarking Guide
StorageSearch.com: How fast can your SSD run backwards?
OpenStack: How to calculate IOPS for Cinder Storage ?
StorageAcceleration: Tips for Measuring Your Storage Acceleration

server storage I/O STI and SUT

Spiceworks: Determining HDD SSD SSHD IOP Performance
Spiceworks: Calculating IOPS from Perfmon data
Spiceworks: profiling IOPs

vdbench server storage I/O benchmark
Vdbench example via StorageIOblog.com

StorageIOblog: What does server storage I/O scaling mean to you?
StorageIOblog: What is the best kind of IO? The one you do not have to do
Testmyworkload.com: Collect and report various OS workloads
Whoishostingthis: Various SQL resources
StorageAcceleration: What, When, Why & How to Accelerate Storage
Filesystems.org: Various tools and links
StorageIOblog: Can we get a side of context with them IOPS and other storage metrics?

flash ssd and hdd

BrightTalk Webinar: Data Center Monitoring – Metrics that Matter for Effective Management
StorageIOblog: Enterprise SSHD and Flash SSD Part of an Enterprise Tiered Storage Strategy
StorageIOblog: Has SSD put Hard Disk Drives (HDD’s) On Endangered Species List?

server storage I/O bottlenecks and I/O blender

Microsoft TechNet: Measuring Disk Latency with Windows Performance Monitor (Perfmon)
Via Scalegrid.io: How to benchmark MongoDB with YCSB? (Perfmon)
Microsoft MSDN: List of Perfmon counters for sql server
Microsoft TechNet: Taking Your Server’s Pulse
StorageIOblog: Part II: How many IOPS can a HDD, HHDD or SSD do with VMware?
CMG: I/O Performance Issues and Impacts on Time-Sensitive Applications

flash ssd and hdd

Virtualization Practice: IO IO it is off to Storage and IO metrics we go
InfoStor: Is HP Short Stroking for Performance and Capacity Gains?
StorageIOblog: Is Computer Data Storage Complex? It Depends
StorageIOblog: More storage and IO metrics that matter
StorageIOblog: Moving Beyond the Benchmark Brouhaha
Yellow-Bricks: VSAN VDI Benchmarking and Beta refresh!

server storage I/O benchmark example

YellowBricks: VSAN performance: many SAS low capacity VS some SATA high capacity?
YellowBricsk: VSAN VDI Benchmarking and Beta refresh!
StorageIOblog: Seagate 1200 12Gbs Enterprise SAS SSD StorgeIO lab review
StorageIOblog: Part II: Seagate 1200 12Gbs Enterprise SAS SSD StorgeIO lab review
StorageIOblog: Server Storage I/O Network Benchmark Winter Olympic Games

flash ssd and hdd

VMware VDImark aka View Planner (also here, here and here) as well as VMmark here
StorageIOblog: SPC and Storage Benchmarking Games
StorageIOblog: Speaking of speeding up business with SSD storage
StorageIOblog: SSD and Storage System Performance

Hadoop server storage I/O performance
Various Server Storage I/O tools in a hadoop environment

Michael-noll.com: Benchmarking and Stress Testing an Hadoop Cluster With TeraSort, TestDFSIO
Virtualization Practice: SSD options for Virtual (and Physical) Environments Part I: Spinning up to speed on SSD
StorageIOblog: Storage and IO metrics that matter
InfoStor: Storage Metrics and Measurements That Matter: Getting Started
SilvertonConsulting: Storage throughput vs. IO response time and why it matters
Splunk: The percentage of Read / Write utilization to get to 800 IOPS?

flash ssd and hdd
Various server storage I/O benchmarking tools

Spiceworks: What is the best IO IOPs testing tool out there
StorageIOblog: How many IOPS can a HDD, HHDD or SSD do?
StorageIOblog: Some Windows Server Storage I/O related commands
Openmaniak: Iperf overview and Iperf.fr: Iperf overview
StorageIOblog: Server and Storage I/O Benchmark Tools: Microsoft Diskspd (Part I and Part II)
Quest: SQL Server Perfmon Poster (PDF)
Server and Storage I/O Networking Performance Management (webinar)
Data Center Monitoring – Metrics that Matter for Effective Management (webinar)
Flash back to reality – Flash SSD Myths and Realities (Industry trends & benchmarking tips), (MSP CMG presentation)
DBAstackexchange: How can I determine how many IOPs I need for my AWS RDS database?
ITToolbox: Benchmarking the Performance of SANs

server storage IO labs

StorageIOblog: Dell Inspiron 660 i660, Virtual Server Diamond in the rough (Server review)
StorageIOblog: Part II: Lenovo TS140 Server and Storage I/O Review (Server review)
StorageIOblog: DIY converged server software defined storage on a budget using Lenovo TS140
StorageIOblog: Server storage I/O Intel NUC nick knack notes First impressions (Server review)
StorageIOblog & ITKE: Storage performance needs availability, availability needs performance
StorageIOblog: Why SSD based arrays and storage appliances can be a good idea (Part I)
StorageIOblog: Revisiting RAID storage remains relevant and resources

Interested in cloud and object storage visit our objectstoragecenter.com page, for flash SSD checkout storageio.com/ssd page, along with data protection, RAID, various industry links and more here.

Additional learning experiences along with common questions (and answers), as well as tips can be found in Software Defined Data Infrastructure Essentials book.

Software Defined Data Infrastructure Essentials Book SDDC

What This All Means

Watch for additional links to be added above in addition to those that appear via comments.

Ok, nuff said, for now.

Gs

Greg Schulz – Microsoft MVP Cloud and Data Center Management, VMware vExpert 2010-2017 (vSAN and vCloud). Author of Software Defined Data Infrastructure Essentials (CRC Press), as well as Cloud and Virtual Data Storage Networking (CRC Press), The Green and Virtual Data Center (CRC Press), Resilient Storage Networks (Elsevier) and twitter @storageio. Courteous comments are welcome for consideration. First published on https://storageioblog.com any reproduction in whole, in part, with changes to content, without source attribution under title or without permission is forbidden.

All Comments, (C) and (TM) belong to their owners/posters, Other content (C) Copyright 2006-2024 Server StorageIO and UnlimitedIO. All Rights Reserved. StorageIO is a registered Trade Mark (TM) of Server StorageIO.

Part II: How many IOPS can a HDD HHDD SSD do with VMware?

How many IOPS can a HDD HHDD SSD do with VMware?

server storage data infrastructure i/o iop hdd ssd trends

Updated 2/10/2018

This is the second post of a two-part series looking at storage performance, specifically in the context of drive or device (e.g. mediums) characteristics of How many IOPS can a HDD HHDD SSD do with VMware. In the first post the focus was around putting some context around drive or device performance with the second part looking at some workload characteristics (e.g. benchmarks).

A common question is how many IOPS (IO Operations Per Second) can a storage device or system do?

The answer is or should be it depends.

Here are some examples to give you some more insight.

For example, the following shows how IOPS vary by changing the percent of reads, writes, random and sequential for a 4K (4,096 bytes or 4 KBytes) IO size with each test step (4 minutes each).

IO Size for test
Workload Pattern of test
Avg. Resp (R+W) ms
Avg. IOP Sec (R+W)
Bandwidth KB Sec (R+W)
4KB
100% Seq 100% Read
0.0
29,736
118,944
4KB
60% Seq 100% Read
4.2
236
947
4KB
30% Seq 100% Read
7.1
140
563
4KB
0% Seq 100% Read
10.0
100
400
4KB
100% Seq 60% Read
3.4
293
1,174
4KB
60% Seq 60% Read
7.2
138
554
4KB
30% Seq 60% Read
9.1
109
439
4KB
0% Seq 60% Read
10.9
91
366
4KB
100% Seq 30% Read
5.9
168
675
4KB
60% Seq 30% Read
9.1
109
439
4KB
30% Seq 30% Read
10.7
93
373
4KB
0% Seq 30% Read
11.5
86
346
4KB
100% Seq 0% Read
8.4
118
474
4KB
60% Seq 0% Read
13.0
76
307
4KB
30% Seq 0% Read
11.6
86
344
4KB
0% Seq 0% Read
12.1
82
330

Dell/Western Digital (WD) 1TB 7200 RPM SATA HDD (Raw IO) thread count 1 4K IO size

In the above example the drive is a 1TB 7200 RPM 3.5 inch Dell (Western Digital) 3Gb SATA device doing raw (non file system) IO. Note the high IOP rate with 100 percent sequential reads and a small IO size which might be a result of locality of reference due to drive level cache or buffering.

Some drives have larger buffers than others from a couple to 16MB (or more) of DRAM that can be used for read ahead caching. Note that this level of cache is independent of a storage system, RAID adapter or controller or other forms and levels of buffering.

Does this mean you can expect or plan on getting those levels of performance?

I would not make that assumption, and thus this serves as an example of using metrics like these in the proper context.

Building off of the previous example, the following is using the same drive however with a 16K IO size.

IO Size for test
Workload Pattern of test
Avg. Resp (R+W) ms
Avg. IOP Sec (R+W)
Bandwidth KB Sec (R+W)
16KB
100% Seq 100% Read
0.1
7,658
122,537
16KB
60% Seq 100% Read
4.7
210
3,370
16KB
30% Seq 100% Read
7.7
130
2,080
16KB
0% Seq 100% Read
10.1
98
1,580
16KB
100% Seq 60% Read
3.5
282
4,522
16KB
60% Seq 60% Read
7.7
130
2,090
16KB
30% Seq 60% Read
9.3
107
1,715
16KB
0% Seq 60% Read
11.1
90
1,443
16KB
100% Seq 30% Read
6.0
165
2,644
16KB
60% Seq 30% Read
9.2
109
1,745
16KB
30% Seq 30% Read
11.0
90
1,450
16KB
0% Seq 30% Read
11.7
85
1,364
16KB
100% Seq 0% Read
8.5
117
1,874
16KB
60% Seq 0% Read
10.9
92
1,472
16KB
30% Seq 0% Read
11.8
84
1,353
16KB
0% Seq 0% Read
12.2
81
1,310

Dell/Western Digital (WD) 1TB 7200 RPM SATA HDD (Raw IO) thread count 1 16K IO size

The previous two examples are excerpts of a series of workload simulation tests (ok, you can call them benchmarks) that I have done to collect information, as well as try some different things out.

The following is an example of the summary for each test output that includes the IO size, workload pattern (reads, writes, random, sequential), duration for each workload step, totals for reads and writes, along with averages including IOP’s, bandwidth and latency or response time.

disk iops

Want to see more numbers, speeds and feeds, check out the following table which will be updated with extra results as they become available.

Device
Vendor
Make

Model

Form Factor
Capacity
Interface
RPM Speed
Raw
Test Result
HDD
HGST
Desktop
HK250-160
2.5
160GB
SATA
5.4K
HDD
Seagate
Mobile
ST2000LM003
2.5
2TB
SATA
5.4K
HDD
Fujitsu
Desktop
MHWZ160BH
2.5
160GB
SATA
7.2K
HDD
Seagate
Momentus
ST9160823AS
2.5
160GB
SATA
7.2K
HDD
Seagate
MomentusXT
ST95005620AS
2.5
500GB
SATA
7.2K(1)
HDD
Seagate
Barracuda
ST3500320AS
3.5
500GB
SATA
7.2K
HDD
WD/Dell
Enterprise
WD1003FBYX
3.5
1TB
SATA
7.2K
HDD
Seagate
Barracuda
ST3000DM01
3.5
3TB
SATA
7.2K
HDD
Seagate
Desktop
ST4000DM000
3.5
4TB
SATA
HDD
HDD
Seagate
Capacity
ST6000NM00
3.5
6TB
SATA
HDD
HDD
Seagate
Capacity
ST6000NM00
3.5
6TB
12GSAS
HDD
HDD
Seagate
Savio 10K.3
ST9300603SS
2.5
300GB
SAS
10K
HDD
Seagate
Cheetah
ST3146855SS
3.5
146GB
SAS
15K
HDD
Seagate
Savio 15K.2
ST9146852SS
2.5
146GB
SAS
15K
HDD
Seagate
Ent. 15K
ST600MP0003
2.5
600GB
SAS
15K
SSHD
Seagate
Ent. Turbo
ST600MX0004
2.5
600GB
SAS
SSHD
SSD
Samsung
840 PRo
MZ-7PD256
2.5
256GB
SATA
SSD
HDD
Seagate
600 SSD
ST480HM000
2.5
480GB
SATA
SSD
SSD
Seagate
1200 SSD
ST400FM0073
2.5
400GB
12GSAS
SSD

Performance characteristics 1 worker (thread count) for RAW IO (non-file system)

Note: (1) Seagate Momentus XT is a Hybrid Hard Disk Drive (HHDD) based on a 7.2K 2.5 HDD with SLC nand flash integrated for read buffer in addition to normal DRAM buffer. This model is a XT I (4GB SLC nand flash), may add an XT II (8GB SLC nand flash) at some future time.

As a starting point, these results are raw IO with file system based information to be added soon along with more devices. These results are for tests with one worker or thread count, other results will be added with such as 16 workers or thread counts to show how those differ.

The above results include all reads, all writes, mix of reads and writes, along with all random, sequential and mixed for each IO size. IO sizes include 4K, 8K, 16K, 32K, 64K, 128K, 256K, 512K, 1024K and 2048K. As with any workload simulation, benchmark or comparison test, take these results with a grain of salt as your mileage can and will vary. For example you will see some what I consider very high IO rates with sequential reads even without file system buffering. These results might be due to locality of reference of IO’s being resolved out of the drives DRAM cache (read ahead) which vary in size for different devices. Use the vendor model numbers in the table above to check the manufactures specs on drive DRAM and other attributes.

If you are used to seeing 4K or 8K and wonder why anybody would be interested in some of the larger sizes take a look at big fast data or cloud and object storage. For some of those applications 2048K may not seem all that big. Likewise if you are used to the larger sizes, there are still applications doing smaller sizes. Sorry for those who like 512 byte or smaller IO’s as they are not included. Note that for all of these unless indicated a 512 byte standard sector or drive format is used as opposed to emerging Advanced Format (AF) 4KB sector or block size. Watch for some more drive and device types to be added to the above, along with results for more workers or thread counts, along with file system and other scenarios.

Using VMware as part of a Server, Storage and IO (aka StorageIO) test platform

vmware vexpert

The above performance results were generated on Ubuntu 12.04 (since upgraded to 14.04 which was hosted on a VMware vSphere 5.1 (upgraded to 5.5U2) purchased version (you can get the ESXi free version here) with vCenter enabled system. I also have VMware workstation installed on some of my Windows-based laptops for doing preliminary testing of scripts and other activity prior to running them on the larger server-based VMware environment. Other VMware tools include vCenter Converter, vSphere Client and CLI. Note that other guest virtual machines (VMs) were idle during the tests (e.g. other guest VMs were quiet). You may experience different results if you ran Ubuntu native on a physical machine or with different adapters, processors and device configurations among many other variables (that was a disclaimer btw ;) ).

Storage I/O trends

All of the devices (HDD, HHDD, SSD’s including those not shown or published yet) were Raw Device Mapped (RDM) to the Ubuntu VM bypassing VMware file system.

Example of creating an RDM for local SAS or SATA direct attached device.

vmkfstools -z /vmfs/devices/disks/naa.600605b0005f125018e923064cc17e7c /vmfs/volumes/dat1/RDM_ST1500Z110S6M5.vmdk

The above uses the drives address (find by doing a ls -l /dev/disks via VMware shell command line) to then create a vmdk container stored in a dat. Note that the RDM being created does not actually store data in the .vmdk, it’s there for VMware management operations.

If you are not familiar with how to create a RDM of a local SAS or SATA device, check out this post to learn how.This is important to note in that while VMware was used as a platform to support the guest operating systems (e.g. Ubuntu or Windows), the real devices are not being mapped through or via VMware virtual drives.

vmware iops

The above shows examples of RDM SAS and SATA devices along with other VMware devices and dats. In the next figure is an example of a workload being run in the test environment.

vmware iops

One of the advantages of using VMware (or other hypervisor) with RDM’s is that I can quickly define via software commands where a device gets attached to different operating systems (e.g. the other aspect of software defined storage). This means that after a test run, I can quickly simply shutdown Ubuntu, remove the RDM device from that guests settings, move the device just tested to a Windows guest if needed and restart those VMs. All of that from where ever I happen to be working from without physically changing things or dealing with multi-boot or cabling issues.

Where To Learn More

View additional NAS, NVMe, SSD, NVM, SCM, Data Infrastructure and HDD related topics via the following links.

Additional learning experiences along with common questions (and answers), as well as tips can be found in Software Defined Data Infrastructure Essentials book.

Software Defined Data Infrastructure Essentials Book SDDC

What This All Means

So how many IOPs can a device do?

That depends, however have a look at the above information and results.

Check back from time to time here to see what is new or has been added including more drives, devices and other related themes.

Ok, nuff said, for now.

Gs

Greg Schulz – Microsoft MVP Cloud and Data Center Management, VMware vExpert 2010-2017 (vSAN and vCloud). Author of Software Defined Data Infrastructure Essentials (CRC Press), as well as Cloud and Virtual Data Storage Networking (CRC Press), The Green and Virtual Data Center (CRC Press), Resilient Storage Networks (Elsevier) and twitter @storageio. Courteous comments are welcome for consideration. First published on https://storageioblog.com any reproduction in whole, in part, with changes to content, without source attribution under title or without permission is forbidden.

All Comments, (C) and (TM) belong to their owners/posters, Other content (C) Copyright 2006-2024 Server StorageIO and UnlimitedIO. All Rights Reserved. StorageIO is a registered Trade Mark (TM) of Server StorageIO.