Cloud Conversations AWS Azure Service Maps via Microsoft

Cloud Conversations AWS Azure Service Maps via Microsoft

server storage I/O data infrastructure trends

Updated 1/21/2018

Microsoft has created an Amazon Web Service AWS Azure Service Map. The AWS Azure Service Map is a list created by Microsoft looks at corresponding services of both cloud providers.

Azure AWS service map via Microsoft.com
Image via Azure.Microsoft.com

Note that this is an evolving work in progress from Microsoft and use it as a tool to help position the different services from Azure and AWS.

Also note that not all features or services may not be available in different regions, visit Azure and AWS sites to see current availability.

As with any comparison they are often dated the day they are posted hence this is a work in progress. If you are looking for another Microsoft created why Azure vs. AWS then check out this here. If you are looking for an AWS vs. Azure, do a simple Google (or Bing) search and watch all the various items appear, some sponsored, some not so sponsored among others.

Whats In the Service Map

The following AWS and Azure services are mapped:

  • Marketplace (e.g. where you select service offerings)
  • Compute (Virtual Machines instances, Containers, Virtual Private Servers, Serverless Microservices and Management)
  • Storage (Primary, Secondary, Archive, Premium SSD and HDD, Block, File, Object/Blobs, Tables, Queues, Import/Export, Bulk transfer, Backup, Data Protection, Disaster Recovery, Gateways)
  • Network & Content Delivery (Virtual networking, virtual private networks and virtual private cloud, domain name services (DNS), content delivery network (CDN), load balancing, direct connect, edge, alerts)
  • Database (Relational, SQL and NoSQL document and key value, caching, database migration)
  • Analytics and Big Data (data warehouse, data lake, data processing, real-time and batch, data orchestration, data platforms, analytics)
  • Intelligence and IoT (IoT hub and gateways, speech recognition, visualization, search, machine learning, AI)
  • Management and Monitoring (management, monitoring, advisor, DevOps)
  • Mobile Services (management, monitoring, administration)
  • Security, Identity and Access (Security, directory services, compliance, authorization, authentication, encryption, firewall
  • Developer Tools (workflow, messaging, email, API management, media trans coding, development tools, testing, DevOps)
  • Enterprise Integration (application integration, content management)

Down load a PDF version of the service map from Microsoft here.

Where To Learn More

Learn more about related technology, trends, tools, techniques, and tips with the following links.

Additional learning experiences along with common questions (and answers), as well as tips can be found in Software Defined Data Infrastructure Essentials book.

Software Defined Data Infrastructure Essentials Book SDDC

What This All Means

On one hand this can and will likely be used as a comparison however use caution as both Azure and AWS services are rapidly evolving, adding new features, extending others. Likewise the service regions and site of data centers also continue to evolve thus use the above as a general guide or tool to help map what service offerings are similar between AWS and Azure.

By the way, if you have not heard, its Blogtober, check out some of the other blogs and posts occurring during October here.

Ok, nuff said, for now.

Gs

Greg Schulz – Microsoft MVP Cloud and Data Center Management, VMware vExpert 2010-2017 (vSAN and vCloud). Author of Software Defined Data Infrastructure Essentials (CRC Press), as well as Cloud and Virtual Data Storage Networking (CRC Press), The Green and Virtual Data Center (CRC Press), Resilient Storage Networks (Elsevier) and twitter @storageio. Courteous comments are welcome for consideration. First published on https://storageioblog.com any reproduction in whole, in part, with changes to content, without source attribution under title or without permission is forbidden.

All Comments, (C) and (TM) belong to their owners/posters, Other content (C) Copyright 2006-2024 Server StorageIO and UnlimitedIO. All Rights Reserved. StorageIO is a registered Trade Mark (TM) of Server StorageIO.

May 2017 Server StorageIO Data Infrastructures Update Newsletter

Volume 17, Issue V

Hello and welcome to the May 2017 issue of the Server StorageIO update newsletter.

Summer officially here in the northern hemisphere is still a few weeks away, however for all practical purposes it has arrived. What this means is that in addition to normal workplace activities and projects, there are plenty of outdoor things (as well as distractions) to attend to.

Over the past several months I have mentioned a new book that is due out this summer and which means it’s getting close to announcement time. The new book title is Software Defined Data Infrastructure Essentials – Cloud, Converged, and Virtual Fundamental Server Storage I/O Tradecraft (CRC PRess/Taylor Francis/Auerbach) that you can learn more about here (with more details being added soon). A common question is will there be electronic versions of the book and the answer is yes (more on this in future newsletter).

Data Infrastructures

Another common question is what is it about, what is a data infrastructure (see this post) and what is tradecraft (see this post). Software-Defined Data Infrastructures Essentials provides fundamental coverage of physical, cloud, converged, and virtual server storage I/O networking technologies, trends, tools, techniques, and tradecraft skills.

Software-Defined Data Infrastructures Essentials provides fundamental coverage of physical, cloud, converged, and virtual server storage I/O networking technologies, trends, tools, techniques, and tradecraft skills. From webscale, software-defined, containers, database, key-value store, cloud, and enterprise to small or medium-size business, the book is filled with techniques, and tips to help develop or refine your server storage I/O hardware, software, and services skills. Whether you are new to data infrastructures or a seasoned pro, you will find this comprehensive reference indispensable for gaining as well as expanding experience with technologies, tools, techniques, and trends.

Software-Defined Data Infrastructure Essentials SDDI SDDC
ISBN-13: 978-1498738156
ISBN-10: 149873815X
Hardcover: 672 pages
Publisher: Auerbach Publications; 1 edition (June 2017)
Language: English

Watch for more news and insight about my new book Software-Defined Data Infrastructure Essentials soon. In the meantime, check out the various items below in this edition of the Server StorageIO Update.

In This Issue

Enjoy this edition of the Server StorageIO update newsletter.

Cheers GS

Data Infrastructure and IT Industry Activity Trends

Some recent Industry Activities, Trends, News and Announcements include:

Flackbox.com has some new independent (non NetApp produced) learning resources including NetApp simulator eBook and MetroCluster tutorial. Over in the Microsoft world, Thomas Maurer has a good piece about Windows Server build 2017 and all about containers. Microsoft also announced SQL Server 2017 CTP 2.1 is now available. Meanwhile here are some my experiences and thoughts from test driving Microsoft Azure Stack.

Speaking of NetApp among other announcements they released a new version of their StorageGrid object storage software. NVMe activity in the industry (and at customer sites) continues to increase with Cavium Qlogic NVMe over Fabric news, along with Broadcom recent NVMe RAID announcements. Keep in mind that if the answer is NVMe, than what are the questions.

Here is a good summary of the recent OpenStack Boston Summit. Storpool did a momentum announcement which for those of you into software defined storage, add Storpool to your watch list. On the VMware front, check out this vSAN 6.6 demo (video) of stretched cluster via Yellow Bricks.

Check out other industry news, comments, trends perspectives here.


Server StorageIOblog Posts

Recent and popular Server StorageIOblog posts include:

View other recent as well as past StorageIOblog posts here

Server StorageIO Commentary in the news

Recent Server StorageIO industry trends perspectives commentary in the news.

Via EnterpriseStorageForum: What to Do with Legacy Assets in a Flash Storage World
There is still a place for hybrid arrays. A hybrid array is the home run when it comes to leveraging your existing non-flash, non-SSD based assets today.

Via EnterpriseStorageForum: Where All-Flash Storage Makes No Sense
A bit of flash in the right place can go a long way, and everybody can benefit from at least a some of flash somewhere. Some might say the more, the better. But where you have budget constraints that simply prevent you from having more flash for things such as cold, inactive, or seldom access data, you should explore other options.

Via Bitpipe: Changing With the Times – Protecting VMs(PDF)

Via FedTech: Storage Strategies: Agencies Optimize Data Centers by Focusing on Storage

Via SearchCloudStorage: Dell EMC cloud storage strategy needs to cut through fog

Via SearchStorage: Microsemi upgrades controllers based on HPE technology

Via EnterpriseStorageForum: 8 Data Machine Learning and AI Storage Tips

Via SiliconAngle: Dell EMC announces hybrid cloud platform for Azure Stack

View more Server, Storage and I/O trends and perspectives comments here

Events and Activities

Recent and upcoming event activities.

Sep. 13-15, 2017 – Fujifilm IT Executive Summit – Seattle WA

August 28-30, 2017 – VMworld – Las Vegas

Jully 22, 2017 – TBA

June 22, 2017 – Webinar – GDPR and Microsoft Environments

May 11, 2017 – Webinar – Email Archiving, Compliance and Ransomware

See more webinars and activities on the Server StorageIO Events page here.

Server StorageIO Industry Resources and Links

Useful links and pages:
Microsoft TechNet – Various Microsoft related from Azure to Docker to Windows
storageio.com/links – Various industry links (over 1,000 with more to be added soon)
objectstoragecenter.com – Cloud and object storage topics, tips and news items
OpenStack.org – Various OpenStack related items
storageio.com/protect – Various data protection items and topics
thenvmeplace.com – Focus on NVMe trends and technologies
thessdplace.com – NVM and Solid State Disk topics, tips and techniques
storageio.com/converge – Various CI, HCI and related SDS topics
storageio.com/performance – Various server, storage and I/O benchmark and tools
VMware Technical Network – Various VMware related items

Ok, nuff said, for now.

Cheers
Gs

Greg Schulz – Microsoft MVP Cloud and Data Center Management, VMware vExpert (and vSAN). Author Cloud and Virtual Data Storage Networking (CRC Press), The Green and Virtual Data Center (CRC Press), Resilient Storage Networks (Elsevier) and twitter @storageio. Watch for the spring 2017 release of his new book "Software-Defined Data Infrastructure Essentials" (CRC Press).

Courteous comments are welcome for consideration. First published on https://storageioblog.com any reproduction in whole, in part, with changes to content, without source attribution under title or without permission is forbidden.

All Comments, (C) and (TM) belong to their owners/posters, Other content (C) Copyright 2006-2023 Server StorageIO(R) and UnlimitedIO. All Rights Reserved.

Gaining Server Storage I/O Insight into Microsoft Windows Server 2016

Server Storage I/O Insight into Microsoft Windows Server 2016

server storage I/O trends
Updated 12/8/16

In case you had not heard, Microsoft announced the general availability (GA, also known as Release To Manufacturing (RTM) ) of the newest version of its Windows server operating system aka Windows Server 2016 along with System Center 2016. Note that as well as being released to traditional manufacturing distribution mediums as well as MSDN, the Windows Server 2016 bits are also available on Azure.

Microsoft Windows Server 2016
Windows Server 2016 Welcome Screen – Source Server StorageIOlab.com

For some this might be new news, or a refresh of what Microsoft announced a few weeks ago (e.g. the formal announcement). Likewise, some of you may not be aware that Microsoft is celebrating WIndows Server 20th Birthday (read more here).

Yet for others who have participated in the public beta aka public technical previews (TP) over the past year or two or simply after the information coming out of Microsoft and other venues, there should not be a lot of surprises.

Whats New With Windows Server 2016

Microsoft Windows Server 2016 Desktop
Windows Server 2016 Desktop and tools – Source Server StorageIOlab.com

Besides a new user interface including visual GUI and Powershell among others, there are many new feature functionalities summarized below:

  • Enhanced time-server with 1ms accuracy
  • Nano and Windows Containers (Linux via Hyper-V)
  • Hyper-V enhanced Linux services including shielded VMs
  • Simplified management (on-premisess and cloud)
  • Storage Spaces Direct (S2D) and Storage Replica (SR) – view more here and here


Storage Replica (SR) Scenarios including synchronous and asynchronous – Via Microsoft.com

  • Resilient File System aka ReFS (now default file system) storage tiering (cache)
  • Hot-swap virtual networking device support
  • Reliable Change Tracking (RCT) for faster Hyper-V backups
  • RCT improves resiliency vs. VSS change tracking
  • PowerShell and other management enhancements
  • Including subordinated / delegated management roles
  • Compliment Azure AD with on premise AD
  • Resilient/HA RDS using Azure SQL DB for connection broker
  • Encrypted VMs (at rest and during live migration)
  • AD Federation Services (FS) authenticate users in LDAP dir.
  • vTPM for securing and encrypting Hyper-V VMs
  • AD Certificate Services (CS) increase support for TPM
  • Enhanced TPM support for smart card access management
  • AD Domain Services (DS) security resiliency for hybrid and mobile devices

Here is a Microsoft TechNet post that goes into more detail of what is new in WIndows Server 2016.

Free ebook: Introducing Windows Server 2016 Technical Preview (Via Microsoft Press)

Check out the above free ebook, after looking through it, I recommend adding it to your bookshelf. There are lots of good intro and overview material for Windows Server 2016 to get you up to speed quickly, or as a refresh.

Storage Spaces Direct (S2D) CI and HCI

Storage Spaces Direct (S2D) builds on Storage Spaces that appeared in earlier Windows and Windows Server editions. Some of the major changes and enhancements include ability to leverage local direct attached storage (DAS) such as internal (or external) dedicated NVMe, SAS and SATA HDDs as well as flash SSDs that used for creating software defined storage for various scenarios.

Scenarios include converged infrastructure (CI) disaggregated as well as aggregated hyper-converged infrastructure (HCI) for Hyper-V among other workloads. Windows Server 2016 S2D nodes communicate (from a storage perspective) via a software storage bus. Data Protection and availability is enabled between S2D nodes via Storage Replica (SR) that can do software based synchronous and asynchronous replication.


Aggregated – Hyper-Converged Infrastructure (HCI) – Source Microsoft.com


Desegregated – Converged Infrastructure (CI) – Source Microsoft.com

The following is a Microsoft produced YouTube video providing a nice overview and insight into Windows Server 2016 and Microsoft Software Defined Storage aka S2D.


YouTube Video Storage Spaces Direct (S2D) via Microsoft.com

Server storage I/O performance

What About Performance?

A common question that comes up with servers, storage, I/O and software defined data infrastructure is what about performance?

Following are some various links to different workloads showing performance for Hyper-V, S2D and Windows Server. Note as with any benchmark, workload or simulation take them for what they are, something to compare that may or might not be applicable to your own workload and environments.

  • Large scale VM performance with Hyper-V and in-memory transaction processing (Via Technet)
  • Benchmarking Microsoft Hyper-V server, VMware ESXi and Xen Hypervisors (Via cisjournal PDF)
  • Server 2016 Impact on VDI User Experience (Via LoginVSI)
  • Storage IOPS update with Storage Spaces Direct (Via TechNet)
  • SQL Server workload (benchmark) Order Processing Benchmark using In-Memory OLTP (Via Github)
  • Setting up testing Windows Server 2016 and S2D using virtual machines (Via MSDN blogs)
  • Storage throughput with Storage Spaces Direct (S2D TP5 (Via TechNet)
  • Server and Storage I/O Benchmark Tools: Microsoft Diskspd (Part I)

Where To Learn More

For those of you not as familiar with Microsoft Windows Server and related topics, or that simply need a refresh, here are several handy links as well as resources.

  • Introducing Windows Server 2016 (Free ebook from Microsoft Press)
  • What’s New in Windows Server 2016 (Via TechNet)
  • Microsoft S2D Software Storage Bus (Via TechNet)
  • Understanding Software Defined Storage with S2D in Windows Server 2016 (Via TechNet)
  • Microsoft Storage Replica (SR) (Via TechNet)
  • Server and Storage I/O Benchmark Tools: Microsoft Diskspd (Part I)
  • Microsoft Windows S2D Software Defined Storage (Via TechNet)
  • Windows Server 2016 and Active Directory (Redmond Magazine Webinar)
  • Data Protection for Modern Microsoft Environments (Redmond Magazine Webinar)
  • Resilient File System aka ReFS (Via TechNet)
  • DISKSPD now on GitHub, and the mysterious VMFLEET released (Via TechNet)
  • Hyper-converged solution using Storage Spaces Direct in Windows Server 2016 (Via TechNet)
  • NVMe, SSD and HDD storage configurations in Storage Spaces Direct TP5 (Via TechNet)
  • General information about SSD at www.thessdplace.com and NVMe at www.thenvmeplace.com
  • How to run nested Hyper-V and Windows Server 2016 (Via Altaro and via MSDN)
  • How to run Nested Windows Server and Hyper-V on VMware vSphere ESXi (Via Nokitel)
  • Get the Windows Server 2016 evaluation bits here
  • Microsoft Azure Stack overview and related material via Microsoft
  • Introducing Windows Server 2016 (Via MicrosoftPress)
  • Various WIndows Server and S2D lab scripts (Via Github)
  • Storage Spaces Direct – Lab Environment Setup (Via Argon Systems)
  • Setting up S2D with a 4 node configuration (Via StarWind blog)
  • SQL Server workload (benchmark) Order Processing Benchmark using In-Memory OLTP (Via Github)
  • Setting up testing Windows Server 2016 and S2D here using virtual machines (Via MSDN blogs)
  • Hyper-V large-scale VM performance for in-memory transaction processing (Via Technet)
  • BrightTalk Webinar – Software-Defined Data Centers (SDDC) are in your Future (if not already here)
  • Microsoft TechNet: Understand the cache in Storage Spaces Direct
  • BrightTalk Weibniar – Software-Defined Data Infrastructures Enabling Software-Defined Data Centers
  • Happy 20th Birthday Windows Server, ready for Server 2016?
  • Server StorageIO resources including added links, tools, reports, events and more.

What This All Means

While Microsoft Windows Server recently celebrated its 20th birthday (or anniversary), a lot has changed as well as evolved. This includes Windows Servers 2016 supporting new deployment and consumption models (e.g. lightweight Nano, full data center with desktop interface, on-premises, bare metal, virtualized (Hyper-V, VMware, etc) as well as cloud). Besides how consumed and configured, which can also be for CI and HCI modes, Windows Server 2016 along with Hyper-V extend the virtualization and container capabilities into non-Microsoft environments specifically around Linux and Docker. Not only are the support for those environments and platforms enhanced, so to are the management capabilities and interfaces from Powershell to Bash Linux shell being part of WIndows 10 and Server 2016.

What this all means is that if you have not looked at Windows Server in some time, its time you do, even if you are not a WIndows or Microsoft fan, you will want to know what it is that has been updated (perhaps even update your fud if that is the case) to stay current. Get your hands on the bits and try Windows Server 2016 on a bare metal server, or as a VM guest, or via cloud including Azure, or simply leverage the above resources to learn more and stay informed.

Ok, nuff said, for now…

Cheers
Gs

Greg Schulz – Microsoft MVP Cloud and Data Center Management, vSAN and VMware vExpert. Author Cloud and Virtual Data Storage Networking (CRC Press), The Green and Virtual Data Center (CRC Press) and Resilient Storage Networks (Elsevier) and twitter @storageio

All Comments, (C) and (TM) belong to their owners/posters, Other content (C) Copyright 2006-2023 Server StorageIO(R) and UnlimitedIO All Rights Reserved

Which Enterprise HDD for Content Server Platform

Which Enterprise HDD to use for a Content Server Platform

data infrastructure HDD server storage I/O trends

Updated 1/23/2018

Which enterprise HDD to use with a content server platform?

Insight for effective server storage I/O decision making
Server StorageIO Lab Review

Which enterprise HDD to use for content servers

This post is the first in a multi-part series based on a white paper hands-on lab report I did compliments of Equus Computer Systems and Seagate that you can read in PDF form here. The focus is looking at the Equus Computer Systems (www.equuscs.com) converged Content Solution platforms with Seagate Enterprise Hard Disk Drive (HDD’s). I was given the opportunity to do some hands-on testing running different application workloads with a 2U content solution platform along with various Seagate Enterprise 2.5” HDD’s handle different application workloads. This includes Seagate’s Enterprise Performance HDD’s with the enhanced caching feature.

Issues And Challenges

Even though Non-Volatile Memory (NVM) including NAND flash solid state devices (SSDs) have become popular storage for use internal as well as external to servers, there remains the need for HDD’s Like many of you who need to make informed server, storage, I/O hardware, software and configuration selection decisions, time is often in short supply.

A common industry trend is to use SSD and HDD based storage mediums together in hybrid configurations. Another industry trend is that HDD’s continue to be enhanced with larger space capacity in the same or smaller footprint, as well as with performance improvements. Thus, a common challenge is what type of HDD to use for various content and application workloads balancing performance, availability, capacity and economics.

Content Applications and Servers

Fast Content Needs Fast Solutions

An industry and customer trend are that information and data are getting larger, living longer, as well as there is more of it. This ties to the fundamental theme that applications and their underlying hardware platforms exist to process, move, protect, preserve and serve information.

Content solutions span from video (4K, HD, SD and legacy streaming video, pre-/post-production, and editing), audio, imaging (photo, seismic, energy, healthcare, etc.) to security surveillance (including Intelligent Video Surveillance [ISV] as well as Intelligence Surveillance and Reconnaissance [ISR]). In addition to big fast data, other content solution applications include content distribution network (CDN) and caching, network function virtualization (NFV) and software-defined network (SDN), to cloud and other rich unstructured big fast media data, analytics along with little data (e.g. SQL and NoSQL database, key-value stores, repositories and meta-data) among others.

Content Solutions And HDD Opportunities

A common theme with content solutions is that they get defined with some amount of hardware (compute, memory and storage, I/O networking connectivity) as well as some type of content software. Fast content applications need fast software, multi-core processors (compute), large memory (DRAM, NAND flash, SSD and HDD’s) along with fast server storage I/O network connectivity. Content-based applications benefit from having frequently accessed data as close as possible to the application (e.g. locality of reference).

Content solution and application servers need flexibility regarding compute options (number of sockets, cores, threads), main memory (DRAM DIMMs), PCIe expansion slots, storage slots and other connectivity. An industry trend is leveraging platforms with multi-socket processors, dozens of cores and threads (e.g. logical processors) to support parallel or high-concurrent content applications. These servers have large amounts of local storage space capacity (NAND flash SSD and HDD) and associated I/O performance (PCIe, NVMe, 40 GbE, 10 GbE, 12 Gbps SAS etc.) in addition to using external shared storage (local and cloud).

Where To Learn More

Additional learning experiences along with common questions (and answers), as well as tips can be found in Software Defined Data Infrastructure Essentials book.

Software Defined Data Infrastructure Essentials Book SDDC

What This All Means

Fast content applications need fast content and flexible content solution platforms such as those from Equus Computer Systems and HDD’s from Seagate. Key to a successful content application deployment is having the flexibility to hardware define and software defined the platform to meet your needs. Just as there are many different types of content applications along with diverse environments, content solution platforms need to be flexible, scalable and robust, not to mention cost effective.

Continue reading part two of this multi-part series here where we look at how and what to test as well as project planning.

Ok, nuff said, for now.

Gs

Greg Schulz – Microsoft MVP Cloud and Data Center Management, VMware vExpert 2010-2017 (vSAN and vCloud). Author of Software Defined Data Infrastructure Essentials (CRC Press), as well as Cloud and Virtual Data Storage Networking (CRC Press), The Green and Virtual Data Center (CRC Press), Resilient Storage Networks (Elsevier) and twitter @storageio. Courteous comments are welcome for consideration. First published on https://storageioblog.com any reproduction in whole, in part, with changes to content, without source attribution under title or without permission is forbidden.

All Comments, (C) and (TM) belong to their owners/posters, Other content (C) Copyright 2006-2024 Server StorageIO and UnlimitedIO. All Rights Reserved. StorageIO is a registered Trade Mark (TM) of Server StorageIO.

Part 4 – Which HDD for Content Applications – Database Workloads

Part 4 – Which HDD for Content Applications – Database Workloads

data base server storage I/O trends

Updated 1/23/2018
Which enterprise HDD to use with a content server platform for database workloads

Insight for effective server storage I/O decision making
Server StorageIO Lab Review

Which enterprise HDD to use for content servers

This is the fourth in a multi-part series (read part three here) based on a white paper hands-on lab report I did compliments of Servers Direct and Seagate that you can read in PDF form here. The focus is looking at the Servers Direct (www.serversdirect.com) converged Content Solution platforms with Seagate Enterprise Hard Disk Drive (HDD’s). In this post the focus expands to database application workloads that were run to test various HDD’s.

Database Reads/Writes

Transaction Processing Council (TPC) TPC-C like workloads were run against the SUT from the STI. These workloads simulated transactional, content management, meta-data and key-value processing. Microsoft SQL Server 2012 was configured and used with databases (each 470GB e.g. scale 6000) created and workload generated by virtual users via Dell Benchmark Factory (running on STI Windows 2012 R2).

A single SQL Server database instance (8) was used on the SUT, however unique databases were created for each HDD set being tested. Both the main database file (.mdf) and the log file (.ldf) were placed on the same drive set being tested, keep in mind the constraints mentioned above. As time was a constraint, database workloads were run concurrent (9) with each other except for the Enterprise 10K RAID 1 and RAID 10. Workload was run with two 10K HDD’s in a RAID 1 configuration, then another workload run with a four drive RAID 10. In a production environment, ideally the .mdf and .ldf would be placed on separate HDD’s and SSDs.

To improve cache buffering the SQL Server database instance memory could be increased from 16GB to a larger number that would yield higher TPS numbers. Keep in mind the objective was not to see how fast I could make the databases run, rather how the different drives handled the workload.

(Note 8) The SQL Server Tempdb was placed on a separate NVMe flash SSD, also the database instance memory size was set to 16GB which was shared by all databases and virtual users accessing it.

(Note 9) Each user step was run for 90 minutes with a 30 minute warm-up preamble to measure steady-state operation.

Users

TPCC Like TPS

Single Drive Cost per TPS

Drive Cost per TPS

Single Drive Cost / Per GB Raw Cap.

Cost / Per GB Usable (Protected) Cap.

Drive Cost (Multiple Drives)

Protect
Space Over head

Cost per usable GB per TPS

Resp. Time (Sec.)

ENT 15K R1

1

23.9

$24.94

$49.89

$0.99

$0.99

$1,190

100%

$49.89

0.01

ENT 10K R1

1

23.4

$37.38

$74.77

$0.49

$0.49

$1,750

100%

$74.77

0.01

ENT CAP R1

1

16.4

$24.26

$48.52

$0.20

$0.20

$ 798

100%

$48.52

0.03

ENT 10K R10

1

23.2

$37.70

$150.78

$0.49

$0.97

$3,500

100%

$150.78

0.07

ENT CAP SWR5

1

17.0

$23.45

$117.24

$0.20

$0.25

$1,995

20%

$117.24

0.02

ENT 15K R1

20

362.3

$1.64

$3.28

$0.99

$0.99

$1,190

100%

$3.28

0.02

ENT 10K R1

20

339.3

$2.58

$5.16

$0.49

$0.49

$1,750

100%

$5.16

0.01

ENT CAP R1

20

213.4

$1.87

$3.74

$0.20

$0.20

$ 798

100%

$3.74

0.06

ENT 10K R10

20

389.0

$2.25

$9.00

$0.49

$0.97

$3,500

100%

$9.00

0.02

ENT CAP SWR5

20

216.8

$1.84

$9.20

$0.20

$0.25

$1,995

20%

$9.20

0.06

ENT 15K R1

50

417.3

$1.43

$2.85

$0.99

$0.99

$1,190

100%

$2.85

0.08

ENT 10K R1

50

385.8

$2.27

$4.54

$0.49

$0.49

$1,750

100%

$4.54

0.09

ENT CAP R1

50

103.5

$3.85

$7.71

$0.20

$0.20

$ 798

100%

$7.71

0.45

ENT 10K R10

50

778.3

$1.12

$4.50

$0.49

$0.97

$3,500

100%

$4.50

0.03

ENT CAP SWR5

50

109.3

$3.65

$18.26

$0.20

$0.25

$1,995

20%

$18.26

0.42

ENT 15K R1

100

190.7

$3.12

$6.24

$0.99

$0.99

$1,190

100%

$6.24

0.49

ENT 10K R1

100

175.9

$4.98

$9.95

$0.49

$0.49

$1,750

100%

$9.95

0.53

ENT CAP R1

100

59.1

$6.76

$13.51

$0.20

$0.20

$ 798

100%

$13.51

1.66

ENT 10K R10

100

560.6

$1.56

$6.24

$0.49

$0.97

$3,500

100%

$6.24

0.14

ENT CAP SWR5

100

62.2

$6.42

$32.10

$0.20

$0.25

$1,995

20%

$32.10

1.57

Table-2 TPC-C workload results various number of users across different drive configurations

Figure-2 shows TPC-C TPS (red dashed line) workload scaling over various number of users (1, 20, 50, and 100) with peak TPS per drive shown. Also shown is the used space capacity (in green), with total raw storage capacity in blue cross hatch. Looking at the multiple metrics in context shows that the 600GB Enterprise 15K HDD with performance enhanced cache is a premium option as an alternative, or, to complement flash SSD solutions.

database TPCC transactional workloads
Figure-2 472GB Database TPS scaling along with cost per TPS and storage space used

In figure-2, the 1.8TB Enterprise 10K HDD with performance enhanced cache while not as fast as the 15K, provides a good balance of performance, space capacity and cost effectiveness. A good use for the 10K drives is where some amount of performance is needed as well as a large amount of storage space for less frequently accessed content.

A low cost, low performance option would be the 2TB Enterprise Capacity HDD’s that have a good cost per capacity, however lack the performance of the 15K and 10K drives with enhanced performance cache. A four drive RAID 10 along with a five drive software volume (Microsoft WIndows) are also shown. For apples to apples comparison look at costs vs. capacity including number of drives needed for a given level of performance.

Figure-3 is a variation of figure-2 showing TPC-C TPS (blue bar) and response time (red-dashed line) scaling across 1, 20, 50 and 100 users. Once again the Enterprise 15K with enhanced performance cache feature enabled has good performance in an apples to apples RAID 1 comparison.

Note that the best performance was with the four drive RAID 10 using 10K HDD’s Given popularity, a four drive RAID 10 configuration with the 10K drives was used. Not surprising the four 10K drives performed better than the RAID 1 15Ks. Also note using five drives in a software spanned volume provides a large amount of storage capacity and good performance however with a larger drive footprint.

database TPCC transactional workloads scaling
Figure-3 472GB Database TPS scaling along with response time (latency)

From a cost per space capacity perspective, the Enterprise Capacity drives have a good cost per GB. A hybrid solution for environment that do not need ultra-high performance would be to pair a small amount of flash SSD (10) (drives or PCIe cards), as well as the 10K and 15K performance enhanced drives with the Enterprise Capacity HDD (11) along with cache or tiering software.

(Note 10) Refer to Seagate 1200 12 Gbps Enterprise SAS SSD StorageIO lab review

(Note 11) Refer to Enterprise SSHD and Flash SSD Part of an Enterprise Tiered Storage Strategy

Where To Learn More

Additional learning experiences along with common questions (and answers), as well as tips can be found in Software Defined Data Infrastructure Essentials book.

Software Defined Data Infrastructure Essentials Book SDDC

What This All Means

If your environment is using applications that rely on databases, then test resources such as servers, storage, devices using tools that represent your environment. This means moving up the software and technology stack from basic storage I/O benchmark or workload generator tools such as Iometer among others instead using either your own application, or tools that can replay or generate various workloads that represent your environment.

Continue reading part five in this multi-part series here where the focus shifts to large and small file I/O processing workloads.

Ok, nuff said, for now.

Gs

Greg Schulz – Microsoft MVP Cloud and Data Center Management, VMware vExpert 2010-2017 (vSAN and vCloud). Author of Software Defined Data Infrastructure Essentials (CRC Press), as well as Cloud and Virtual Data Storage Networking (CRC Press), The Green and Virtual Data Center (CRC Press), Resilient Storage Networks (Elsevier) and twitter @storageio. Courteous comments are welcome for consideration. First published on https://storageioblog.com any reproduction in whole, in part, with changes to content, without source attribution under title or without permission is forbidden.

All Comments, (C) and (TM) belong to their owners/posters, Other content (C) Copyright 2006-2024 Server StorageIO and UnlimitedIO. All Rights Reserved. StorageIO is a registered Trade Mark (TM) of Server StorageIO.

HDDs evolve for Content Application servers

HDDs evolve for Content Application servers

hdds evolve server storage I/O trends

Updated 1/23/2018

Enterprise HDDs evolve for content server platform

Insight for effective server storage I/O decision making
Server StorageIO Lab Review

Which enterprise HDD to use for content servers

This is the seventh and final post in this multi-part series (read part six here) based on a white paper hands-on lab report I did compliments of Servers Direct and Seagate that you can read in PDF form here. The focus is looking at the Servers Direct (www.serversdirect.com) converged Content Solution platforms with Seagate Enterprise Hard Disk Drive (HDD’s). The focus of this post is comparing how HDD continue to evolve over various generations boosting performance as well as capacity and reliability. This also looks at how there is more to HDD performance than the traditional focus on Revolutions Per Minute (RPM) as a speed indicator.

Comparing Different Enterprise 10K And 15K HDD Generations

There is more to HDD performance than RPM speed of the device. RPM plays an important role, however there are other things that impact HDD performance. A common myth is that HDD’s have not improved on performance over the past several years with each successive generation. Table-10 shows a sampling of various generations of enterprise 10K and 15K HDD’s (14) including different form factors and how their performance continues to improve.

different 10K and 15K HDDs
Figure-9 10K and 15K HDD performance improvements

Figure-9 shows how performance continues to improve with 10K and 15K HDD’s with each new generation including those with enhanced cache features. The result is that with improvements in cache software within the drives, along with enhanced persistent non-volatile memory (NVM) and incremental mechanical drive improvements, both read and write performance continues to be enhanced.

Figure-9 puts into perspective the continued performance enhancements of HDD’s comparing various enterprise 10K and 15K devices. The workload is the same TPC-C tests used earlier in a similar (14) (with no RAID). 100 simulated users are shown in figure-9 accessing a database on each of the different drives all running concurrently. The older 15K 3.5” Cheetah and 2.5” Savio used had a capacity of 146GB which used a database scale factor of 1500 or 134GB. All other drives used a scale factor 3000 or 276GB. Figure-9 also highlights the improvements in both TPS performance as well as lower response time with new HDD’s including those with performance enhanced cache feature.

The workloads run are same as the TPC-C ones shown earlier, however these drives were not configured with any RAID. The TPC-C activity used Benchmark Factory with similar setup and configuration to those used earlier including on a multi-socket, multi-core Windows 2012 R2 server supporting a Microsoft SQL Server 2012 database with a database for each drive type.

ENT 10K V3 2.5"

ENT (Cheetah) 15K 3.5"

Users

1

20

50

100

Users

1

20

50

100

TPS (TPC-C)

14.8

50.9

30.3

39.9

TPS (TPC-C)

14.6

51.3

27.1

39.3

Resp. Time (Sec.)

0.0

0.4

1.6

1.7

Resp. Time (Sec.)

0.0

0.3

1.8

2.1

ENT 10K 2.5" (with cache)

ENT (Savio) 15K 2.5"

Users

1

20

50

100

Users

1

20

50

100

TPS (TPC-C)

19.2

146.3

72.6

71.0

TPS (TPC-C)

15.8

59.1

40.2

53.6

Resp. Time (Sec.)

0.0

0.1

0.7

0.0

Resp. Time (Sec.)

0.0

0.3

1.2

1.2

ENT 15K V4 2.5"

Users

1

20

50

100

TPS (TPC-C)

19.7

119.8

75.3

69.2

Resp. Time (Sec.)

0.0

0.1

0.6

1.0

ENT 15K (enhanced cache) 2.5"

Users

1

20

50

100

TPS (TPC-C)

20.1

184.1

113.7

122.1

Resp. Time (Sec.)

0.0

0.1

0.4

0.2

Table-10 Continued Enterprise 10K and 15K HDD performance improvements

(Note 14) 10K and 15K generational comparisons were run on a separate comparable server to what was used for other test workloads. Workload configuration settings were the same as other database workloads including using Microsoft SQL Server 2012 on a Windows 2012 R2 system with Benchmark Factory driving the workload. Database memory sized was reduced however to only 8GB vs. 16GB used in other tests.

Where To Learn More

Additional learning experiences along with common questions (and answers), as well as tips can be found in Software Defined Data Infrastructure Essentials book.

Software Defined Data Infrastructure Essentials Book SDDC

What This All Means

A little bit of flash in the right place with applicable algorithms goes a long way, an example being the Seagate Enterprise HDD’s with enhanced cache feature. Likewise, HDD’s are very much alive complementing SSD and vice versa. For high-performance content application workloads flash SSD solutions including NVMe, 12Gbps SAS and 6Gbps SATA devices are cost effective solutions. HDD’s continue to be cost-effective data storage devices for both capacity, as well as environments that do not need the performance of flash SSD.

For some environments using a combination of flash and HDD’s complementing each other along with cache software can be a cost-effective solution. The previous workload examples provide insight for making cost-effective informed storage decisions.

Evaluate today’s HDD’s on their effective performance running workloads as close as similar to your own, or, actually try them out with your applications. Today there is more to HDD performance than just RPM speed, particular with the Seagate Enterprise Performance 10K and 15K HDD’s with enhanced caching feature.

However the Enterprise Performance 10K with enhanced cache feature provides a good balance of capacity, performance while being cost-effective. If you are using older 3.5” 15K or even previous generation 2.5” 15K RPM and “non-performance enhanced” HDD’s, take a look at how the newer generation HDD’s perform, looking beyond the RPM of the device.

Fast content applications need fast content and flexible content solution platforms such as those from Servers Direct and HDD’s from Seagate. Key to a successful content application deployment is having the flexibility to hardware define and software defined the platform to meet your needs. Just as there are many different types of content applications along with diverse environments, content solution platforms need to be flexible, scalable and robust, not to mention cost effective.

Ok, nuff said, for now.

Gs

Greg Schulz – Microsoft MVP Cloud and Data Center Management, VMware vExpert 2010-2017 (vSAN and vCloud). Author of Software Defined Data Infrastructure Essentials (CRC Press), as well as Cloud and Virtual Data Storage Networking (CRC Press), The Green and Virtual Data Center (CRC Press), Resilient Storage Networks (Elsevier) and twitter @storageio. Courteous comments are welcome for consideration. First published on https://storageioblog.com any reproduction in whole, in part, with changes to content, without source attribution under title or without permission is forbidden.

All Comments, (C) and (TM) belong to their owners/posters, Other content (C) Copyright 2006-2024 Server StorageIO and UnlimitedIO. All Rights Reserved. StorageIO is a registered Trade Mark (TM) of Server StorageIO.

Collecting Transaction Per Minute from SQL Server and HammerDB

Storage I/O trends

Collecting Transaction Per Minute from SQL Server and HammerDB

When using benchmark or workload generation tools such as HammerDB I needed a way to capture and log performance activity metrics such as transactions per minute. For example using HammerDB to simulate an application making database requests performing various transactions as part of testing an overall system solution including server and storage I/O activity. This post takes a look at the problem or challenge I was looking to address, as well as creating a solution after spending time searching for one (still searching btw).

The Problem, Issue, Challenge, Opportunity and Need

The challenge is to collect application performance such as transactions per minute from a workload using a database. The workload or benchmark tool (in this case HammerDB) is the System Test Initiator (STI) that drives the activity (e.g. database requests) to a System Under Test (SUT). In this example the SUT is a Microsoft SQL Server running on a Windows 2012 R2 server. What I need is to collect and log into a file for later analysis the transaction rate per minute while the STI is generating a particular workload.

Server Storage I/O performance

Understanding the challenge and designing a strategy

If you have ever used benchmark or workload generation tools such as Quest Benchmark Factory (part of the Toad tools collection) you might be spoiled with how it can be used to not only generate the workload, as well as collect, process, present and even store the results for database workloads such as TPC simulations. In this situation, Transaction Processing Council (TPC) like workloads need to be run and metrics on performance collected. Lets leave Benchmark Factory for a future discussion and focus instead on a free tool called HammerDB and more specifically how to collection transactions per minute metrics from Microsoft SQL Server. While the focus is SQL Server, you can easily adapt the approach for MySQL among others, not to mention there are tools such as Sysbench, Aerospike among other tools.

The following image (created using my Livescribe Echo digital pen) outlines the problem, as well as sketches out a possible solution design. In the following figure, for my solution I’m going to show how to grab every minute for a given amount of time the count of transactions that have occurred. Later in the post processing (you could also do in the SQL Script) I take the new transaction count (which is cumulative) and subtract the earlier interval which yields the transactions per minute (see examples later in this post).

collect TPM metrics from SQL Server with hammerdb
The problem and challenge, a way to collect Transactions Per Minute (TPM)

Finding a solution

HammerDB displays results via its GUI, and perhaps there is a way or some trick to get it to log results to a file or some other means, however after searching the web, found that it was quicker to come up with solution. That solution was to decide how to collect and report the transactions per minute (or you could do by second or other interval) from Microsoft SQL Server. The solution was to find what performance counters and metrics are available from SQL Server, how to collect those and log them to a file for processing. What this means is a SQL Server script file would need to be created that ran in a loop collecting for a given amount of time at a specified interval. For example once a minute for several hours.

Taking action

The following is a script that I came up with that is far from optimal however it gets the job done and is a starting point for adding more capabilities or optimizations.

In the following example, set loopcount to some number of minutes to collect samples for. Note however that if you are running a workload test for eight (8) hours with a 30 minute ramp-up time, you would want to use a loopcount (e.g. number of minutes to collect for) of 480 + 30 + 10. The extra 10 minutes is to allow for some samples before the ramp and start of workload, as well as to give a pronounced end of test number of samples. Add or subtract however many minutes to collect for as needed, however keep this in mind, better to collect a few extra minutes vs. not have them and wished you did.

-- Note and disclaimer:
-- 
-- Use of this code sample is at your own risk with Server StorageIO and UnlimitedIO LLC
-- assuming no responsibility for its use or consequences. You are free to use this as is
-- for non-commercial scenarios with no warranty implied. However feel free to enhance and
-- share those enhancements with others e.g. pay it forward.
-- 
DECLARE @cntr_value bigint;
DECLARE @loopcount bigint; # how many minutes to take samples for

set @loopcount = 240

SELECT @cntr_value = cntr_value
 FROM sys.dm_os_performance_counters
 WHERE counter_name = 'transactions/sec'
 AND object_name = 'MSSQL$DBIO:Databases'
 AND instance_name = 'tpcc' ; print @cntr_value;
 WAITFOR DELAY '00:00:01'
-- 
-- Start loop to collect TPM every minute
-- 

while @loopcount <> 0
begin
SELECT @cntr_value = cntr_value
 FROM sys.dm_os_performance_counters
 WHERE counter_name = 'transactions/sec'
 AND object_name = 'MSSQL$DBIO:Databases'
 AND instance_name = 'tpcc' ; print @cntr_value;
 WAITFOR DELAY '00:01:00'
 set @loopcount = @loopcount - 1
end
-- 
-- All done with loop, write out the last value
-- 
SELECT @cntr_value = cntr_value
 FROM sys.dm_os_performance_counters
 WHERE counter_name = 'transactions/sec'
 AND object_name = 'MSSQL$DBIO:Databases'
 AND instance_name = 'tpcc' ; print @cntr_value;
-- 
-- End of script
-- 

The above example has loopcount set to 240 for a 200 minute test with a 30 minute ramp and 10 extra minutes of samples. I use the a couple of the minutes to make sure that the system test initiator (STI) such as HammerDB is configured and ready to start executing transactions. You could also put this along with your HammerDB items into a script file for further automation, however I will leave that exercise up to you.

For those of you familiar with SQL and SQL Server you probably already see some things to improve or stylized or simply apply your own preference which is great, go for it. Also note that I’m only selecting a certain variable from the performance counters as there are many others which you can easily discovery with a couple of SQL commands (e.g. select and specify database instance and object name. Also note that the key is accessing the items in sys.dm_os_performance_counters of your SQL Server database instance.

The results

The output from the above is a list of cumulative numbers as shown below which you will need to post process (or add a calculation to the above script). Note that part of running the script is specifying an output file which I show later.

785
785
785
785
37142
1259026
2453479
3635138

Implementing the solution

You can setup the above script to run as part of a larger automation shell or batch script, however for simplicity I’m showing it here using Microsoft SQL Server Studio.

SQL Server script to collect TPM
Microsoft SQL Server Studio with script to collect Transaction Per Minute (TPM)

The following image shows how to specify an output file for the results to be logged to when using Microsoft SQL Studio to run the TPM collection script.

Specify SQL Server tpm output file
Microsoft SQL Server Studio specify output file

With the SQL Server script running to collect results, and HammerDB workload running to generate activity, the following shows Quest Spotlight on Windows (SoW) displaying WIndows Server 2012 R2 operating system level performance including CPU, memory, paging and other activity. Note that this example had about the system test initiator (STI) which is HammerDB and the system under test (SUT) that is Microsoft SQL Server on the same server.

Spotlight on Windows while SQL Server doing tpc
Quest Spotlight on Windows showing Windows Server performance activity

Results and post-processing

As part of post processing simple use your favorite tool or script or what I often do is pull the numbers into Excel spreadsheet, and simply create a new column of numbers that computes and shows the difference between each step (see below). While in Excel then I plot the numbers as needed which can also be done via a shell script and other plotting tools such as R.

In the following example, the results are imported into Excel (your favorite tool or script) where I then add a column (B) that simple computes the difference between the existing and earlier counter. For example in cell B2 = A2-A1, B3 = A3-A2 and so forth for the rest of the numbers in column A. I then plot the numbers in column B to show the transaction rates over time that can then be used for various things.

Hammerdb TPM results from SQL Server processed in Excel
Results processed in Excel and plotted

Note that in the above results that might seem too good to be true they are, these were cached results to show the tools and data collection process as opposed to the real work being done, at least for now…

Where to learn more

Here are some extra links to have a look at:

How to test your HDD, SSD or all flash array (AFA) storage fundamentals
Server and Storage I/O Benchmarking 101 for Smarties
Server and Storage I/O Benchmark Tools: Microsoft Diskspd (Part I)
The SSD Place (collection of flash and SSD resources)
Server and Storage I/O Benchmarking and Performance Resources
I/O, I/O how well do you know about good or bad server and storage I/Os?

What this all means and wrap-up

There are probably many ways to fine tune and optimize the above script, likewise there may even be some existing tool, plug-in, add-on module, or configuration setting that allows HammerDB to log the transaction activity rates to a file vs. simply showing on a screen. However for now, this is a work around that I have found for when needing to collect transaction activity performance data with HammerDB and SQL Server.

Ok, nuff said, for now…

Cheers gs

Greg Schulz – Author Cloud and Virtual Data Storage Networking (CRC Press), The Green and Virtual Data Center (CRC Press) and Resilient Storage Networks (Elsevier)
twitter @storageio

All Comments, (C) and (TM) belong to their owners/posters, Other content (C) Copyright 2006-2024 Server StorageIO and UnlimitedIO LLC All Rights Reserved

Microsoft Diskspd (Part II): Server Storage I/O Benchmark Tools

Microsoft Diskspd (Part II): Server Storage I/O Benchmark Tools

server storage I/O trends

This is part-two of a two-part post pertaining Microsoft Diskspd.that is also part of a broader series focused on server storage I/O benchmarking, performance, capacity planning, tools and related technologies. You can view part-one of this post here, along with companion links here.

Microsoft Diskspd StorageIO lab test drive

Server and StorageIO lab

Talking about tools and technologies is one thing, installing as well as trying them is the next step for gaining experience so how about some quick hands-on time with Microsoft Diskspd (download your copy here).

The following commands all specify an I/O size of 8Kbytes doing I/O to a 45GByte file called diskspd.dat located on the F: drive. Note that a 45GByte file is on the small size for general performance testing, however it was used for simplicity in this example. Ideally a larger target storage area (file, partition, device) would be used, otoh, if your application uses a small storage device or volume, then tune accordingly.

In this test, the F: drive is an iSCSI RAID protected volume, however you could use other storage interfaces supported by Windows including other block DAS or SAN (e.g. SATA, SAS, USB, iSCSI, FC, FCoE, etc) as well as NAS. Also common to the following commands is using 16 threads and 32 outstanding I/Os to simulate concurrent activity of many users, or application processing threads.
server storage I/O performance
Another common parameter used in the following was -r for random, 7200 seconds (e.g. two hour) test duration time, display latency ( -L ) disable hardware and software cache ( -h), forcing cpu affinity (-a0,1,2,3). Since the test ran on a server with four cores I wanted to see if I could use those for helping to keep the threads and storage busy. What varies in the commands below is the percentage of reads vs. writes, as well as the results output file. Some of the workload below also had the -S option specified to disable OS I/O buffering (to view how buffering helps when enabled or disabled). Depending on the goal, or type of test, validation, or workload being run, I would choose to set some of these parameters differently.

diskspd -c45g -b8K -t16 -o32 -r -d7200 -h -w0 -L -a0,1,2,3 F:\diskspd.dat >> SIOWS2012R203_Eiscsi_145_noh_write000.txt

diskspd -c45g -b8K -t16 -o32 -r -d7200 -h -w50 -L -a0,1,2,3 F:\diskspd.dat >> SIOWS2012R203_Eiscsi_145_noh_write050.txt

diskspd -c45g -b8K -t16 -o32 -r -d7200 -h -w100 -L -a0,1,2,3 F:\diskspd.dat >> SIOWS2012R203_Eiscsi_145_noh_write100.txt

diskspd -c45g -b8K -t16 -o32 -r -d7200 -h -S -w0 -L -a0,1,2,3 F:\diskspd.dat >> SIOWS2012R203_Eiscsi_145_noSh_test_write000.txt

diskspd -c45g -b8K -t16 -o32 -r -d7200 -h -S -w50 -L -a0,1,2,3 F:\diskspd.dat >> SIOWS2012R203_Eiscsi_145_noSh_write050.txt

diskspd -c45g -b8K -t16 -o32 -r -d7200 -h -S -w100 -L -a0,1,2,3 F:\diskspd.dat >> SIOWS2012R203_Eiscsi_145_noSh_write100.txt

The following is the output from the above workload command.
Microsoft Diskspd sample output
Microsoft Diskspd sample output part 2
Microsoft Diskspd sample output part 3

Note that as with any benchmark, workload test or simulation your results will vary. In the above the server, storage and I/O system were not tuned as the focus was on working with the tool, determining its capabilities. Thus do not focus on the performance results per say, rather what you can do with Diskspd as a tool to try different things. Btw, fwiw, in the above example in addition to using an iSCSI target, the Windows 2012 R2 server was a guest on a VMware ESXi 5.5 system.

Where to learn more

The following are related links to read more about server (cloud, virtual and physical) storage I/O benchmarking tools, technologies and techniques.

Drew Robb’s benchmarking quick reference guide
Server storage I/O benchmarking tools, technologies and techniques resource page
Server and Storage I/O Benchmarking 101 for Smarties.
Microsoft Diskspd download and Microsoft Diskspd overview (via Technet)
I/O, I/O how well do you know about good or bad server and storage I/Os?
Server and Storage I/O Benchmark Tools: Microsoft Diskspd (Part I and Part II)

Comments and wrap-up

What I like about Diskspd (Pros)

Reporting including CPU usage (you can’t do server and storage I/O without CPU) along with IOP’s (activity), bandwidth (throughout or amount of data being moved), per thread and total results along with optional reporting. While a GUI would be nice particular for beginners, I’m used to setting up scripts for different workloads so having an extensive options for setting up different workloads is welcome. Being associated with a specific OS (e.g. Windows) the CPU affinity and buffer management controls will be handy for some projects.

Diskspd has the flexibility to use different storage interfaces and types of storage including files or partitions should be taken for granted, however with some tools don’t take things for granted. I like the flexibility to easily specify various IO sizes including large 1MByte, 10MByte, 20MByte, 100MByte and 500MByte to simulate application workloads that do large sequential (or random) activity. I tried some IO sizes (e.g. specified by -b parameter larger than 500MB however, I received various errors including "Could not allocate a buffer bytes for target" which means that Diskspd can do IO sizes smaller than that. While not able to do IO sizes larger than 500MB, this is actually impressive. Several other tools I have used or with have IO size limits down around 10MByte which makes it difficult for creating workloads that do large IOP’s (note this is the IOP size, not the number of IOP’s).

Oh, something else that should be obvious however will state it, Diskspd is free unlike some industry de-facto standard tools or workload generators that need a fee to get and use.

Where Diskspd could be improved (Cons)

For some users a GUI or configuration wizard would make the tool easier to get started with, on the other hand (oth), I tend to use the command capabilities of tools. Would also be nice to specify ranges as part of a single command such as stepping through an IO size range (e.g. 4K, 8K, 16K, 1MB, 10MB) as well as read write percentages along with varying random sequential mixes. Granted this can easily be done by having a series of commands, however I have become spoiled by using other tools such as vdbench.

Summary

Server and storage I/O performance toolbox

Overall I like Diskspd and have added it to my Server Storage I/O workload and benchmark tool-box

Keep in mind that the best benchmark or workload generation technology tool will be your own application(s) configured to run as close as possible to production activity levels.

However when that is not possible, the an alternative is to use tools that have the flexibility to be configured as close as possible to your application(s) workload characteristics. This means that the focus should not be as much on the tool, as opposed to how flexible is a tool to work for you, granted the tool needs to be robust.

Having said that, Microsoft Diskspd is a good and extensible tool for benchmarking, simulation, validation and comparisons, however it will only be as good as the parameters and configuration you set it up to use.

Check out Microsoft Diskspd and add it to your benchmark and server storage I/O tool-box like I have done.

Ok, nuff said (for now)

Cheers gs

Greg Schulz – Author Cloud and Virtual Data Storage Networking (CRC Press), The Green and Virtual Data Center (CRC Press) and Resilient Storage Networks (Elsevier)
twitter @storageio

All Comments, (C) and (TM) belong to their owners/posters, Other content (C) Copyright 2006-2024 Server StorageIO and UnlimitedIO LLC All Rights Reserved

December 2014 Server StorageIO Newsletter

December 2014

Hello and welcome to this December Server and StorageIO update newsletter.

Seasons Greetings

Seasons greetings

Commentary In The News

StorageIO news

Following are some StorageIO industry trends perspectives comments that have appeared in various venues. Cloud conversations continue to be popular including concerns about privacy, security and availability. Over at BizTech Magazine there are some comments about cloud and ROI. Some comments on AWS and Google SSD services can be viewed at SearchAWS. View other trends comments here

Tips and Articles

View recent as well as past tips and articles here

StorageIOblog posts

Recent StorageIOblog posts include:

View other recent as well as past blog posts here

In This Issue

  • Industry Trends Perspectives
  • Commentary in the news
  • Tips and Articles
  • StorageIOblog posts
  • Events & Activities

    View other recent and upcoming events here

    Webinars

    December 11, 2014 – BrightTalk
    Server & Storage I/O Performance

    December 10, 2014 – BrightTalk
    Server & Storage I/O Decision Making

    December 9, 2014 – BrightTalk
    Virtual Server and Storage Decision Making

    December 3, 2014 – BrightTalk
    Data Protection Modernization

    Videos and Podcasts

    StorageIO podcasts are also available via and at StorageIO.tv

    From StorageIO Labs

    Research, Reviews and Reports

    StarWind Virtual SAN for Microsoft SOFS

    May require registration
    This looks at the shared storage needs of SMB’s and ROBO’s leveraging Microsoft Scale-Out File Server (SOFS). Focus is on Microsoft Windows Server 2012, Server Message Block version (SMB) 3.0, SOFS and StarWind Virtual SAN management software

    View additional reports and lab reviews here.

    Resources and Links

    Check out these useful links and pages:
    storageio.com/links
    objectstoragecenter.com
    storageioblog.com/data-protection-diaries-main/
    storageio.com/ssd
    storageio.com/ssd

    Enjoy this edition of the Server and StorageIO update newsletter and watch for new tips, articles, StorageIO lab report reviews, blog posts, videos and podcasts along with in the news commentary appearing soon.

    Seasons greetings 2014

    Greg Schulz – Author Cloud and Virtual Data Storage Networking (CRC Press), The Green and Virtual Data Center (CRC Press) and Resilient Storage Networks (Elsevier)
    twitter @storageio

    All Comments, (C) and (TM) belong to their owners/posters, Other content (C) Copyright 2006-2024 Server StorageIO and UnlimitedIO LLC All Rights Reserved

    Seagate 1200 12Gbs Enterprise SAS SSD StorgeIO lab review

    Seagate 1200 12Gbs Enterprise SAS SSD StorgeIO lab review

    This is the first post of a two part series, read the second post here.

    Earlier this year I had the opportunity to test drive some Seagate 1200 12Gbs Enterprise SAS SSD’s as a follow-up to some earlier activity trying their Enterprise TurboBoost Drives. Disclosure: Seagate has been a StorageIO client and was also the sponsor of this white paper and associated proof-points mentioned in this post.

    The question to ask yourself is not if flash Solid State Device (SSD) technologies are in your future, Instead the questions are when, where, using what, how to configure and related themes. SSD including traditional DRAM and NAND flash-based technologies are like real estate where location matters; however, there are different types of properties to meet various needs. This means leveraging different types of NAND flash SSD technologies in different locations in a complementary and cooperative aka hybrid way. For example nand flash SSD as part of an enterprise tiered storage strategy can be implemented server-side using PCIe cards, SAS and SATA drives as targets or as cache along with software, as well as leveraging SSD devices in storage systems or appliances.

    Seagate 1200 SSD
    Seagate 1200 Enterprise SAS 12Gbs SSD Image via Seagate.com

    Another place where nand flash can be found and compliments SSD devices are so-called Solid State Hybrid Drives (SSHD) or Hybrid Hard Disk Drives (HHDD) including a new generation that accelerate writes as well as reads such as those Seagate refers to as with Enterprise TurboBoost. The Enterprise TurboBoost drives (view the companion StorageIO Lab review TurboBoost white paper here) were previously known as the Solid State Hybrid Drives (SSHD) or Hybrid Hard Disk Drives (HHDD). Read more about TurboBoost here and here.

    The best server and storage I/O is the one you do not have to do

    Keep in mind that the best server or storage I/O is that one that you do not have to do, with the second best being the one with the least overhead resolved as close to the processor (compute) as possible or practical. The following figure shows that the best place to resolve server and storage I/O is as close to the compute processor as possible however only a finite amount of storage memory located there. This is where the server memory and storage I/O hierarchy comes into play which is also often thought of in the context of tiered storage balancing performance and availability with cost and architectural limits.

    Also shown is locality of reference which refers to how close data is to where it is being used and includes cache effectiveness or buffering. Hence a small amount of cache of flash and DRAM in the right location can have a large benefit. Now if you can afford it, install as much DRAM along with flash storage as possible, however if you are like most organizations with finite budgets yet server and storage I/O challenges, then deploy a tiered flash storage strategy.

    flash cache locality of reference
    Server memory storage I/O hierarchy, locality of reference

    Seagate 1200 12Gbs Enterprise SAS SSD’s

    Back to the Seagate 1200 12Gbs Enterprise SAS SSD which is covered in this StorageIO Industry Trends Perspective thought leadership white paper. The focus of the white paper is to look at how the Seagate 1200 Enterprise class SSD’s and 12Gbps SAS address current and next generation tiered storage for virtual, cloud, traditional Little and Big Data infrastructure environments.

    Seagate 1200 Enteprise SSD

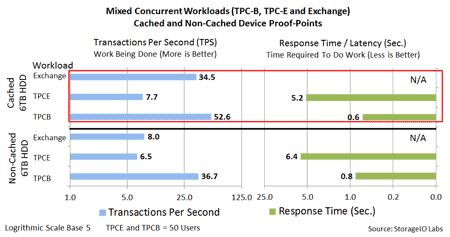
    This includes providing proof points running various workloads including Database TPC-B, TPC-E and Microsoft Exchange in the StorageIO Labs along with cache software comparing SSD, SSHD and different HDD’s including 12Gbs SAS 6TB near-line high-capacity drives.

    Seagate 1200 Enterprise SSD Proof Points

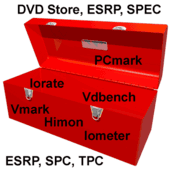
    The proof points in this white paper are from an applications focus perspective representing more of an end-to-end real-world situation. While they are not included in this white paper, StorageIO has run traditional storage building-block focus workloads, which can be found at StorageIOblog (Part II: How many IOPS can a HDD, HHDD or SSD do with VMware?). These include tools such as Iometer, iorate, vdbench among others for various IO sizes, mixed, random, sequential, reads, writes along with “hot-band" across different number of threads (concurrent users). “Hot-Band” is part of the SNIA Emerald energy effectiveness metrics for looking at sustained storage performance using tools such as vdbench. Read more about other various server and storage I/O benchmarking tools and techniques here.

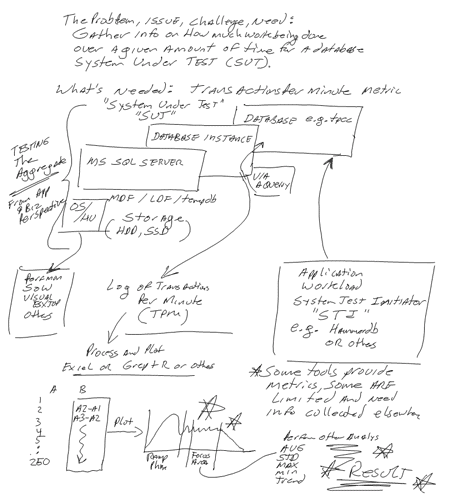
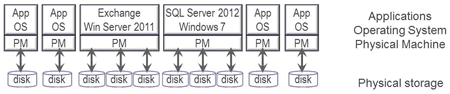
    For the following series of proof-points (TPC-B, TPC-E and Exchange) a system under test (SUT) consisted of a physical server (described with the proof-points) configured with VMware ESXi along with guests virtual machines (VMs) configured to do the storage I/O workload. Other servers were used in the case of TPC workloads as application transactional requester to drive the SQL Server database and resulting server storage I/O workload. VMware was used in the proof-points to reflect a common industry trend of using virtual server infrastructures (VSI) supporting applications including database, email among others. For the proof-point scenarios, the SUT along with storage system device under test were dedicated to that scenario (e.g. no other workload running) unless otherwise noted.

    Server Storage I/O config
    Server Storage I/O configuration for proof-points

    Microsoft Exchange Email proof-point configuration

    For this proof-point, Microsoft Jet Stress Exchange performance workloads were placed (e.g. Exchange Database – EDB file) on each of the different devices under test with various metrics shown including activity rates and response time for reads as well as writes. For the Exchange testing, the EDB was placed on the device being tested while its log files were placed on a separate Seagate 400GB Enterprise 12Gbps SAS SSD.

    Test configuration: Seagate 400GB 12000 2.5” SSD (ST400FM0073) 12Gbps SAS, 600GB 2.5” Enterprise 15K with TurboBoost™ (ST600MX) 6 Gbps SAS, 600GB 2.5” Enterprise Enhanced 15K V4 (15K RPM) HDD (ST600MP) with 6 Gbps SAS, Seagate Enterprise Capacity Nearline (ST6000NM0014) 6TB 3.5” 7.2K RPM HDD 12 Gbps SAS and 3TB 7.2K SATA HDD. Email server hosted as guest on VMware vSphere/ESXi V5.5, Microsoft SBS2011 Service Pack 1 64 bit. Guest VM (VMware vSphere 5.5) was on a SSD based dat, had a physical machine (host), with 14 GB DRAM, quad CPU (4 x 3.192GHz) Intel E3-1225 v300, with LSI 9300 series 12Gbps SAS adapters in a PCIe Gen 3 slot with Jet Stress 2010.  All devices being tested were Raw Device Mapped (RDM) where EDB resided. VM on a SSD based separate data store than devices being tested. Log file IOPs were handled via a separate SSD device also persistent (no delayed writes). EDB was 300GB and workload ran for 8 hours.

    Microsoft Exchange VMware SSD performance
    Microsoft Exchange proof-points comparing various storage devices

    TPC-B (Database, Data Warehouse, Batch updates) proof-point configuration

    SSD’s are a good fit for both transaction database activity with reads and write as well as query-based decision support systems (DSS), data warehouse and big data analytics. The following are proof points of SSD capabilities for database activity. In addition to supporting database table files and objects, along with transaction journal logs, other uses include for meta-data, import/export or other high-IO and write intensive scenarios. Two database workload profiles were tested including batch update (write-intensive) and transactional. Activity involved running Transaction Performance Council (TPC) workloads TPC-B (batch update) and TPC-E (transaction/OLTP simulate financial trading system) against Microsoft SQL Server 2012 databases. Each test simulation had the SQL Server database (MDF) on a different device with transaction log file (LDF) on a separate SSD. TPC-B for a single device results shown below.

    TPC-B (write intensive) results below show how TPS work being done (blue) increases from left to right (more is better) for various numbers of simulated users. Also shown on the same line for each amount of TPS work being done is the average latency in seconds (right to left) where lower is better. Results are shown from top to bottom for each group of users (100, 50, 20 and 1) for the different drives being tested (top to bottom). Note how the SSD device does more work at a lower response time vs. traditional HDD’s

    Test configuration: Seagate 400GB 12000 2.5” SSD (ST400FM0073) 12Gbps SAS, 600GB 2.5” Enterprise 15K with TurboBoost™ (ST600MX) 6 Gbps SAS, 600GB 2.5” Enterprise Enhanced 15K V4 (15K RPM) HDD (ST600MP) with 6 Gbps SAS, Seagate Enterprise Capacity Nearline (ST6000NM0014) 6TB 3.5” 7.2K RPM HDD 12 Gbps SAS and 3TB Seagate 7.2K SATA HDD Workload generator and virtual clients Windows 7 Ultimate 64 bit. Microsoft SQL Server 2012 database was on Windows 7 guest. Guest VM (VMware vSphere 5.5) had a dedicated 14 GB DRAM, quad CPU (4 x 3.192GHz) Intel E3-1225 v300, with LSI 9300 series 12Gbps SAS adapters in a PCIe Gen 3 slot along with TPC-B (www.tpc.org) workloads.

    VM with guest OS along with SQL tempdb and masterdb resided on separate SSD based data store from devices being tested (e.g., where MDF (main database tables) and LDF (log file) resided). All devices being tested were Raw Device Mapped (RDM) independent persistent with database log file on a separate SSD device also persistent (no delayed writes) using VMware PVSCSI driver. MDF and LDF file sizes were 142GB and 26GB with scale factor of 10000, with each step running for one hour (10-minute preamble). Note that these proof-points DO NOT use VMware or any other third-party cache software or I/O acceleration tool technologies as those are covered later in a separate proof-point.

    TPC-B sql server database SSD performance
    TPC-B SQL Server database proof-points comparing various storage devices

    TPC-E (Database, Financial Trading) proof-point configuration

    The following shows results from TPC-E test (OLTP/transactional workload) simulating a financial trading system. TPC-E is an industry standard workload that performs a mix of reads and writes database queries. Proof-points were performed with various numbers of users from 10, 20, 50 and 100 to determine (TPS) Transaction per Second (aka I/O rate) and response time in seconds. The TPC-E transactional results are shown for each device being tested across different user workloads. The results show how TPC-E TPS work (blue) increases from left to right (more is better) for larger numbers of users along with corresponding latency (green) that goes from right to left (less is better). The Seagate Enterprise 1200 SSD is shown on the top in the figure below with a red box around its results. Note how the SSD as a lower latency while doing more work compared to the other traditional HDD’s

    Test configuration: Seagate 400GB 12000 2.5” SSD (ST400FM0073) 12Gbps SAS, 600GB 2.5” Enterprise 15K with TurboBoost™ (ST600MX) 6 Gbps SAS, 600GB 2.5” Enterprise Enhanced 15K V4 (15K RPM) HDD (ST600MP) with 6 Gbps SAS, Seagate Enterprise Capacity Nearline (ST6000NM0014) 6TB 3.5” 7.2K RPM HDD 12 Gbps SAS and 3TB Seagate 7.2K SATA HDD Workload generator and virtual clients Windows 7 Ultimate 64 bit. Microsoft SQL Server 2012 database was on Windows 7 guest. Guest VM (VMware vSphere 5.5) had a dedicated 14 GB DRAM, quad CPU (4 x 3.192GHz) Intel E3-1225 v300, with LSI 9300 series 12Gbps SAS adapters in a PCIe Gen 3 slot along with TPC-B (www.tpc.org) workloads.

    VM with guest OS along with SQL tempdb and masterdb resided on separate SSD based data store from devices being tested (e.g., where MDF (main database tables) and LDF (log file) resided). All devices being tested were Raw Device Mapped (RDM) independent persistent with database log file on a separate SSD device also persistent (no delayed writes) using VMware PVSCSI driver. MDF and LDF file sizes were 142GB and 26GB with scale factor of 10000, with each step running for one hour (10-minute preamble). Note that these proof-points DO NOT use VMware or any other third-party cache software or I/O acceleration tool technologies as those are covered later in a separate proof-point.

    TPC-E sql server database SSD performance
    TPC-E (Financial trading) SQL Server database proof-points comparing various storage devices

    Continue reading part-two of this two-part series here including the virtual server storage I/O blender effect and solution.

    Ok, nuff said (for now).

    Cheers gs

    Greg Schulz – Author Cloud and Virtual Data Storage Networking (CRC Press), The Green and Virtual Data Center (CRC Press) and Resilient Storage Networks (Elsevier)
    twitter @storageio

    All Comments, (C) and (TM) belong to their owners/posters, Other content (C) Copyright 2006-2024 Server StorageIO and UnlimitedIO LLC All Rights Reserved

    Part II: Seagate 1200 12Gbs Enterprise SAS SSD StorgeIO lab review

    Part II: Seagate 1200 12Gbs Enterprise SAS SSD StorgeIO lab review

    This is the second post of a two part series, read the first post here.

    Earlier this year I had the opportunity to test drive some Seagate 1200 12Gbs Enterprise SAS SSD’s as a follow-up to some earlier activity trying their Enterprise TurboBoost Drives. Disclosure: Seagate has been a StorageIO client and was also the sponsor of this white paper and associated proof-points mentioned in this post.

    The Server Storage I/O Blender Effect Bottleneck

    The earlier proof-points focused on SSD as a target or storage device. In the following proof-points, the Seagate Enterprise 1200 SSD is used as a shared read cache (write-through). Using a write-through cache enables a given amount of SSD to give a performance benefit to other local and networked storage devices.

    traditional server storage I/O
    Non-virtualized servers with dedicated storage and I/O paths.

    Aggregation causes aggravation with I/O bottlenecks because of consolidation using server virtualization. The following figure shows non-virtualized servers with their own dedicated physical machine (PM) and I/O resources. When various servers are virtualized and hosted by a common host (physical machine), their various workloads compete for I/O and other resources. In addition to competing for I/O performance resources, these different servers also tend to have diverse workloads.

    virtual server storage I/O blender
    Virtual server storage I/O blender bottleneck (aggregation causes aggravation)

    The figure above shows aggregation causing aggravation with the result being I/O bottlenecks as various applications performance needs converge and compete with each other. The aggregation and consolidation result is a blend of random, sequential, large, small, read and write characteristics. These different storage I/O characteristics are mixed up and need to be handled by the underlying I/O capabilities of the physical machine and hypervisor. As a result, a common deployment for SSD in addition to as a target device for storing data is as a cache to cut bottlenecks for traditional spinning HDD.

    In the following figure a solution is shown introducing I/O caching with SSD to help mitigate or cut the effects of server consolation causing performance aggravations.

    Creating a server storage I/O blender bottleneck

    xxxxx
    Addressing the VMware Server Storage I/O blender with cache

    Addressing server storage I/O blender and other bottlenecks

    For these proof-points, the goal was to create an I/O bottleneck resulting from multiple VMs in a virtual server environment performing application work. In this proof-point, multiple competing VMs including a SQL Server 2012 database and an Exchange server shared the same underlying storage I/O infrastructure including HDD’s The 6TB (Enterprise Capacity) HDD was configured as a VMware dat and allocated as virtual disks to the VMs. Workloads were then run concurrently to create an I/O bottleneck for both cached and non-cached results.

    xxxxx
    Server storage I/O with virtualization roof-point configuration topology

    The following figure shows two sets of proof points, cached (top) and non-cached (bottom) with three workloads. The workloads consisted of concurrent Exchange and SQL Server 2012 (TPC-B and TPC-E) running on separate virtual machine (VM) all on the same physical machine host (SUT) with database transactions being driven by two separate servers. In these proof-points, the applications data were placed onto the 6TB SAS HDD to create a bottleneck, and a portion of the SSD used as a cache. Note that the Virtunet cache software allows you to use a part of a SSD device for cache with the balance used as a regular storage target should you want to do so.

    If you have paid attention to the earlier proof-points, you might notice that some of the results below are not as good as those seen in the Exchange, TPC-B and TPC-E results about. The reason is simply that the earlier proof-points were run without competing workloads, and database along with log or journal files were placed on separate drives for performance. In the following proof-point as part of creating a server storage I/O blender bottleneck the Exchange, TPC-B as well as TPC-E workloads were all running concurrently with all data on the 6TB drive (something you normally would not want to do).

    storage I/O blender solved
    Solving the VMware Server Storage I/O blender with cache

    The cache and non-cached mixed workloads shown above prove how an SSD based read-cache can help to reduce I/O bottlenecks. This is an example of addressing the aggravation caused by aggregation of different competing workloads that are consolidated with server virtualization.

    For the workloads shown above, all data (database tables and logs) were placed on VMware virtual disks created from a dat using a single 7.2K 6TB 12Gbps SAS HDD (e.g. Seagate Enterprise Capacity).

    The guest VM system disks which included paging, applications and other data files were virtual disks using a separate dat mapped to a single 7.2K 1TB HDD. Each workload ran for eight hours with the TPC-B and TPC-E having 50 simulated users. For the TPC-B and TPC-E workloads, two separate servers were used to drive the transaction requests to the SQL Server 2012 database.

    For the cached tests, a Seagate Enterprise 1200 400GB 12Gbps SAS SSD was used as the backing store for the cache software (Virtunet Systems Virtucache) that was installed and configured on the VMware host.

    During the cached tests, the physical HDD for the data files (e.g. 6TB HDD) and system volumes (1TB HDD) were read cache enabled. All caching was disabled for the non-cached workloads.

    Note that this was only a read cache, which has the side benefit of off-loading those activities enabling the HDD to focus on writes, or read-ahead. Also note that the combined TPC-E, TPC-B and Exchange databases, logs and associated files represented over 600GB of data, there was also the combined space and thus cache impact of the two system volumes and their data. This simple workload and configuration is representative of how SSD caching can complement high-capacity HDD’s

    Seagate 6TB 12Gbs SAS high-capacity HDD

    While the star and focus of these series of proof-points is the Seagate 1200 Enterprise 12Gbs SAS SSD, the caching software (virtunet) and Enterprise TurboBoost drives also play key supporting and favorable roles. However the 6TB 12Gbs SAS high-capacity drive caught my attention from a couple of different perspectives. Certainly the space capacity was interesting along with a 12Gbs SAS interface well suited for near-line, high-capacity and dense tiered storage environments. However for a high-capacity drive its performance is what really caught my attention both in the standard exchange, TPC-B and TPC-E workloads, as well as when combined with SSD and cache software.

    This opens the door for a great combination of leveraging some amount of high-performance flash-based SSD (or TurboBoost drives) combined with cache software and high-capacity drives such as the 6TB device (Seagate now has larger versions available). Something else to mention is that the 6TB HDD in addition to being available in either 12Gbs SAS, 6Gbs SAS or 6Gbs SATA also has enhanced durability with a Read Bit Error Rate of 10 ^15 (e.g. 1 second read error per 10^15 average attempts) and an AFR (annual failure rate) of 0.63% (See more speeds and feeds here). Hence if you are concerned about using large capacity HDD’s and them failing, make sure you go with those that have a high Read Bit Error Rate and a low AFR which are more common with enterprise class vs. lower cost commodity or workstation drives. Note that these high-capacity enterprise HDD’s are also available with Self-Encrypting Drive (SED) options.

    Summary

    Read more in this StorageIO Industry Trends and Perspective (ITP) white paper compliments of Seagate 1200 12Gbs SAS SSD’s and visit the Seagate Enterprise 1200 12Gbs SAS SSD page here. Moving forward there is the notion that flash SSD will be everywhere. There is a difference between all data on flash SSD vs. having some amount of SSD involved in preserving, serving and protecting (storing) information.

    Key themes to keep in mind include:

    • Aggregation can cause aggravation which SSD can alleviate
    • A relative small amount of flash SSD in the right place can go a long way
    • Fast flash storage needs fast server storage I/O access hardware and software
    • Locality of reference with data close to applications is a performance enabler
    • Flash SSD everywhere does not mean everything has to be SSD based
    • Having some amount of flash in different places is important for flash everywhere
    • Different applications have various performance characteristics
    • SSD as a storage device or persistent cache can speed up IOPs and bandwidth

    Flash and SSD are in your future, this comes back to the questions of how much flash SSD do you need, along with where to put it, how to use it and when.

    Ok, nuff said (for now).

    Cheers gs

    Greg Schulz – Author Cloud and Virtual Data Storage Networking (CRC Press), The Green and Virtual Data Center (CRC Press) and Resilient Storage Networks (Elsevier)
    twitter @storageio

    All Comments, (C) and (TM) belong to their owners/posters, Other content (C) Copyright 2006-2024 Server StorageIO and UnlimitedIO LLC All Rights Reserved