The other Green Storage: Efficiency and Optimization

Some believe that green storage is specifically designed to reduce power and cooling costs.

The reality is that there are many ways to reduce environmental impact while enhancing the economics of data storage besides simply booting utilizing.

These include optimizing data storage capacity as well as boosting performance to increase productivity per watt of energy used when work needs to be done.

Some approaches require new hardware or software while others can be accomplished with changes to management including reconfiguration leveraging insight and awareness of resource needs.

Here are some related links:

The Other Green: Storage Efficiency and Optimization (Videocast)

Energy efficient technology sales depend on the pitch

Performance metrics: Evaluating your data storage efficiency

How to reduce your Data Footprint impact (Podcast)

Optimizing enterprise data storage capacity and performance to reduce your data footprint

Ok, nuff said.

Cheers gs

Greg Schulz – Author Cloud and Virtual Data Storage Networking (CRC Press), The Green and Virtual Data Center (CRC Press) and Resilient Storage Networks (Elsevier)
twitter @storageio

All Comments, (C) and (TM) belong to their owners/posters, Other content (C) Copyright 2006-2024 Server StorageIO and UnlimitedIO LLC All Rights Reserved

How to win approval for upgrades: Link them to business benefits

Drew Rob has another good article over at Processor.com about various tips and strategies on how to gain approval for hardware (or software) purchases with some comments by yours truly.

My tips and advice that are quoted in the story include to link technology resources to business needs impact which may be common sense, however still a time tested effective technique.

Instead of speaking tech talk such as Performance, capacity, availability, IOPS, bandwidth, GHz, frames or packets per second, VMs to PM or dedupe ratio, map them to business speak, that is things that finance, accountants, MBAs or other management personal understand.

For example, how many transactions at a given response time can be supported by a given type of server, storage or networking device.

Or, put a different way, with a given device, how much work can be done and what is the associated monetary or business benefit.

Likewise, if you do not have a capacity plan for servers, storage, I/O and networking along with software and facilities covering performance, availability, capacity and energy demands now is the time to put one in place.

More on capacity and performance planning later, however for now, if you want to learn more, check Chapter 10 (Performance and Capacity Planning) in my book Resilient Storage Networks: Designing Flexible and Scalable Data Infrastructure: Elsevier).

Ok, nuff said.

Cheers gs

Greg Schulz – Author Cloud and Virtual Data Storage Networking (CRC Press), The Green and Virtual Data Center (CRC Press) and Resilient Storage Networks (Elsevier)
twitter @storageio

All Comments, (C) and (TM) belong to their owners/posters, Other content (C) Copyright 2006-2024 Server StorageIO and UnlimitedIO LLC All Rights Reserved

Optimize Data Storage for Performance and Capacity Efficiency

This post builds on a recent article I did that can be read here.

Even with tough economic times, there is no such thing as a data recession! Thus the importance of optimizing data storage efficiency addressing both performance and capacity without impacting availability in a cost effective way to do more with what you have.

What this means is that even though budgets are tight or have been cut resulting in reduced spending, overall net storage capacity is up year over year by double digits if not higher in some environments.

Consequently, there is continued focus on stretching available IT and storage related resources or footprints further while eliminating barriers or constraints. IT footprint constraints can be physical in a cabinet or rack as well as floorspace, power or cooling thresholds and budget among others.

Constraints can be due to lack of performance (bandwidth, IOPS or transactions), poor response time or lack of availability for some environments. Yet for other environments, constraints can be lack of capacity, limited primary or standby power or cooling constraints. Other constraints include budget, staffing or lack of infrastructure resource management (IRM) tools and time for routine tasks.

Look before you leap
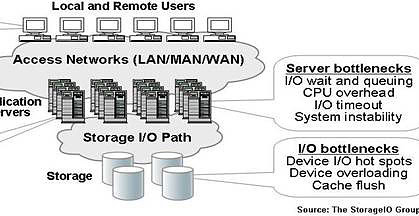
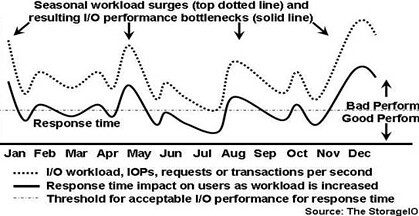
Before jumping into an optimization effort, gain insight if you do not already have it as to where the bottlenecks exist, along with the cause and effect of moving or reconfiguring storage resources. For example, boosting capacity use to more fully use storage resources can result in a performance issue or data center bottlenecks for other environments.

An alternative scenario is that in the quest to boost performance, storage is seen as being under-utilized, yet when capacity use is increased, low and behold, response time deteriorates. The result can be a vicious cycle hence the need to address the issue as opposed to moving problems by using tools to gain insight on resource usage, both space and activity or performance.

Gaining insight means looking at capacity use along with performance and availability activity and how they use power, cooling and floor-space. Consequently an important tool is to gain insight and knowledge of how your resources are being used to deliver various levels of service.

Tools include storage or system resource management (SRM) tools that report on storage space capacity usage, performance and availability with some tools now adding energy usage metrics along with storage or system resource analysis (SRA) tools.

Cooling Off
Power and cooling are commonly talked about as constraints, either from a cost standpoint, or availability of primary or secondary (e.g. standby) energy and cooling capacity to support growth. Electricity is essential for powering IT equipment including storage enabling devices to do their specific tasks of storing data, moving data, processing data or a combination of these attributes.

Thus, power gets consumed, some work or effort to move and store data takes place and the by product is heat that needs to be removed. In a typical IT data center, cooling on average can account for about 50% of energy used with some sites using less.

With cooling being a large consumer of electricity, a small percentage change to how cooling consumes energy can yield large results. Addressing cooling energy consumption can be to discuss budget or cost issues, or to enable cooling capacity to be freed up to support installation of extra storage or other IT equipment.

Keep in mind that effective cooling relies on removing heat from as close to the source as possible to avoid over cooling which requires more energy. If you have not done so, have a facilities review or assessment performed that can range from a quick walk around, to a more in-depth review and thermal airflow analysis. A means of removing heat close to the sort are techniques such as intelligent, precision or smart cooling also known by other marketing names.

Powering Up, or, Powering Down
Speaking of energy or power, in addition to addressing cooling, there are a couple of ways of addressing power consumption by storage equipment (Figure 1). The most popular discussed approach towards efficiency is energy avoidance involving powering down storage when not used such as first generation MAID at the cost of performance.

For off-line storage, tape and other removable media give low-cost capacity per watt with low to no energy needed when not in use. Second generation (e.g. MAID 2.0) solutions with intelligent power management (IPM) capabilities have become more prevalent enabling performance or energy savings on a more granular or selective basis often as a standard feature in common storage systems.

GreenOptionsBalance
Figure 1:  How various RAID levels and configuration impact or benefit footprint constraints

Another approach to energy efficiency is seen in figure 1 which is doing more work for active applications per watt of energy to boost productivity. This can be done by using same amount of energy however doing more work, or, same amount of work with less energy.

For example instead of using larger capacity disks to improve capacity per watt metrics, active or performance sensitive storage should be looked at on an activity basis such as IOP, transactions, videos, emails or throughput per watt. Hence, a fast disk drive doing work can be more energy-efficient in terms of productivity than a higher capacity slower disk drive for active workloads, where for idle or inactive, the inverse should hold true.

On a go forward basis the trend already being seen with some servers and storage systems is to do both more work, while using less energy. Thus a larger gap between useful work (for active or non idle storage) and amount of energy consumed yields a better efficiency rating, or, take the inverse if that is your preference for smaller numbers.

Reducing Data Footprint Impact
Data footprint impact reduction tools or techniques for both on-line as well as off-line storage include archiving, data management, compression, deduplication, space-saving snapshots, thin provisioning along with different RAID levels among other approaches. From a storage access standpoint, you can also include bandwidth optimization, data replication optimization, protocol optimizers along with other network technologies including WAFS/WAAS/WADM to help improve efficiency of data movement or access.

Thin provisioning for capacity centric environments can be used to achieving a higher effective storage use level by essentially over booking storage similar to how airlines oversell seats on a flight. If you have good historical information and insight into how storage capacity is used and over allocated, thin provisioning enables improved effective storage use to occur for some applications.

However, with thin provisioning, avoid introducing performance bottlenecks by leveraging solutions that work closely with tools that providing historical trending information (capacity and performance).

For a technology that some have tried to declare as being dead to prop other new or emerging solutions, RAID remains relevant given its widespread deployment and transparent reliance in organizations of all size. RAID also plays a role in storage performance, availability, capacity and energy constraints as well as a relief tool.

The trick is to align the applicable RAID configuration to the task at hand meeting specific performance, availability, capacity or energy along with economic requirements. For some environments a one size fits all approach may be used while others may configure storage using different RAID levels along with number of drives in RAID sets to meet specific requirements.


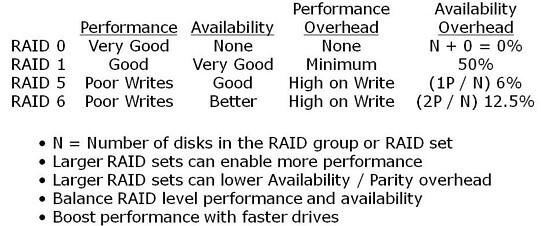
Figure 2:  How various RAID levels and configuration impact or benefit footprint constraints

Figure 2 shows a summary and tradeoffs of various RAID levels. In addition to the RAID levels, how many disks can also have an impact on performance or capacity, such as, by creating a larger RAID 5 or RAID 6 group, the parity overhead can be spread out, however there is a tradeoff. Tradeoffs can be performance bottlenecks on writes or during drive rebuilds along with potential exposure to drive failures.

All of this comes back to a balancing act to align to your specific needs as some will go with a RAID 10 stripe and mirror to avoid risks, even going so far as to do triple mirroring along with replication. On the other hand, some will go with RAID 5 or RAID 6 to meet cost or availability requirements, or, some I have talked with even run RAID 0 for data and applications that need the raw speed, yet can be restored rapidly from some other medium.

Lets bring it all together with an example
Figure 3 shows a generic example of a before and after optimization for a mixed workload environment, granted you can increase or decrease the applicable capacity and performance to meet your specific needs. In figure 3, the storage configuration consists of one storage system setup for high performance (left) and another for high-capacity secondary (right), disk to disk backup and other near-line needs, again, you can scale the approach up or down to your specific need.

For the performance side (left), 192 x 146GB 15K RPM (28TB raw) disks provide good performance, however with low capacity use. This translates into a low capacity per watt value however with reasonable IOPs per watt and some performance hot spots.

On the capacity centric side (right), there are 192 x 1TB disks (192TB raw) with good space utilization, however some performance hot spots or bottlenecks, constrained growth not to mention low IOPS per watt with reasonable capacity per watt. In the before scenario, the joint energy use (both arrays) is about 15 kWh or 15,000 watts which translates to about $16,000 annual energy costs (cooling excluded) assuming energy cost of 12 cents per kWh.

Note, your specific performance, availability, capacity and energy mileage will vary based on particular vendor solution, configuration along with your application characteristics.


Figure 3: Baseline before and after storage optimization (raw hardware) example

Building on the example in figure 3, a combination of techniques along with technologies yields a net performance, capacity and perhaps feature functionality (depends on specific solution) increase. In addition, floor-space, power, cooling and associated footprints are also reduced. For example, the resulting solution shown (middle) comprises 4 x 250GB flash SSD devices, along with 32 x 450GB 15.5K RPM and 124 x 2TB 7200RPM enabling an 53TB (raw) capacity increase along with performance boost.

The previous example are based on raw or baseline capacity metrics meaning that further optimization techniques should yield improved benefits. These examples should also help to discuss the question or myth that it costs more to power storage than to buy it which the answer should be it depends.

If you can buy the above solution for say under $50,000 (cost to power), or, let alone, $100,000 (power and cool) for three years which would also be a good acquisition, then the myth of buying is more expensive than powering holds true. However, if a solution as described above costs more, than the story changes along with other variables include energy costs for your particular location re-enforcing the notion that your mileage will vary.

Another tip is that more is not always better.

That is, more disks, ports, processors, controllers or cache do not always equate into better performance. Performance is the sum of how those and other pieces working together in a demonstrable way, ideally your specific application workload compared to what is on a product data sheet.

Additional general tips include:

  • Align the applicable tool, technique or technology to task at hand
  • Look to optimize for both performance and capacity, active and idle storage
  • Consolidated applications and servers need fast servers
  • Fast servers need fast I/O and storage devices to avoid bottlenecks
  • For active storage use an activity per watt metric such as IOP or transaction per watt
  • For in-active or idle storage, a capacity per watt per footprint metric would apply
  • Gain insight and control of how storage resources are used to meet service requirements

It should go without saying, however sometimes what is understood needs to be restated.

In the quest to become more efficient and optimized, avoid introducing performance, quality of service or availability issues by moving problems.

Likewise, look beyond storage space capacity also considering performance as applicable to become efficient.

Finally, it is all relative in that what might be applicable to one environment or application need may not apply to another.

Ok, nuff said.

Cheers gs

Greg Schulz – Author Cloud and Virtual Data Storage Networking (CRC Press), The Green and Virtual Data Center (CRC Press) and Resilient Storage Networks (Elsevier)
twitter @storageio

All Comments, (C) and (TM) belong to their owners/posters, Other content (C) Copyright 2006-2024 Server StorageIO and UnlimitedIO LLC All Rights Reserved

Data Center I/O Bottlenecks Performance Issues and Impacts

This is an excerpt blog version of the popular Server and StorageIO Group white paper "IT Data Center and Data Storage Bottlenecks" originally published August of 2006 that is as much if not more relevant today than it was in the past.

Most Information Technology (IT) data centers have bottleneck areas that impact application performance and service delivery to IT customers and users. Possible bottleneck locations shown in Figure-1 include servers (application, web, file, email and database), networks, application software, and storage systems. For example users of IT services can encounter delays and lost productivity due to seasonal workload surges or Internet and other network bottlenecks. Network congestion or dropped packets resulting in wasteful and delayed retransmission of data can be the results of network component failure, poor configuration or lack of available low latency bandwidth.

Server bottlenecks due to lack of CPU processing power, memory or under sized I/O interfaces can result in poor performance or in worse case scenarios application instability. Application including database systems bottlenecks due to excessive locking, poor query design, data contention and deadlock conditions result in poor user response time. Storage and I/O performance bottlenecks can occur at the host server due to lack of I/O interconnect bandwidth such as an overloaded PCI interconnect, storage device contention, and lack of available storage system I/O capacity.

These performance bottlenecks, impact most applications and are not unique to the large enterprise or scientific high compute (HPC) environments. The direct impact of data center I/O performance issues include general slowing of the systems and applications, causing lost productivity time for users of IT services. Indirect impacts of data center I/O performance bottlenecks include additional management by IT staff to trouble shoot, analyze, re-configure and react to application delays and service disruptions.


Figure-1: Data center performance bottleneck locations

Data center performance bottleneck impacts (see Figure-1) include:

  • Under utilization of disk storage capacity to compensate for lack of I/O performance capability
  • Poor Quality of Service (QoS) causing Service Level Agreements (SLA) objectives to be missed
  • Premature infrastructure upgrades combined with increased management and operating costs
  • Inability to meet peak and seasonal workload demands resulting in lost business opportunity

I/O bottleneck impacts
It should come as no surprise that businesses continue to consume and rely upon larger amounts of disk storage. Disk storage and I/O performance fuel the hungry needs of applications in order to meet SLAs and QoS objectives. The Server and StorageIO Group sees that, even with efforts to reduce storage capacity or improve capacity utilization with information lifecycle management (ILM) and Infrastructure Resource Management (IRM) enabled infrastructures, applications leveraging rich content will continue to consume more storage capacity and require additional I/O performance. Similarly, at least for the next few of years, the current trend of making and keeping additional copies of data for regulatory compliance and business continue is expected to continue. These demands all add up to a need for more I/O performance capabilities to keep up with server processor performance improvements.


Figure-2: Processing and I/O performance gap

Server and I/O performance gap
The continued need for accessing more storage capacity results in an alarming trend: the expanding gap between server processing power and available I/O performance of disk storage (Figure-2). This server to I/O performance gap has existed for several decades and continues to widen instead of improving. The net impact is that bottlenecks associated with the server to I/O performance lapse result in lost productivity for IT personal and customers who must wait for transactions, queries, and data access requests to be resolved.

Application symptoms of I/O bottlenecks
There are many applications across different industries that are sensitive to timely data access and impacted by common I/O performance bottlenecks. For example, as more users access a popular file, database table, or other stored data item, resource contention will increase. One way resource contention manifests itself is in the form of database “deadlock” which translates into slower response time and lost productivity. 

Given the rise and popularity of internet search engines, search engine optimization (SEO) and on-line price shopping, some businesses have been forced to create expensive read-only copies of databases. These read-only copies are used to support more queries to address bottlenecks from impacting time sensitive transaction databases.

In addition to increased application workload, IT operational procedures to manage and protect data help to contribute to performance bottlenecks. Data center operational procedures result in additional file I/O scans for virus checking, database purge and maintenance, data backup, classification, replication, data migration for maintenance and upgrades as well as data archiving. The net result is that essential data center management procedures contribute to performance challenges and impacting business productivity.

Poor response time and increased latency
Generally speaking, as additional activity or application workload including transactions or file accesses are performed, I/O bottlenecks result in increased response time or latency (shown in Figure-3). With most performance metrics more is better; however, in the case of response time or latency, less is better.  Figure-3 shows the impact as more work is performed (dotted curve) and resulting I/O bottlenecks have a negative impact by increasing response time (solid curve) above acceptable levels. The specific acceptable response time threshold will vary by applications and SLA requirements. The acceptable threshold level based on performance plans, testing, SLAs and other factors including experience serves as a guide line between acceptable and poor application performance.

As more workload is added to a system with existing I/O issues, response time will correspondingly decrease as was seen in Figure-3. The more severe the bottleneck, the faster response time will deteriorate (e.g. increase) from acceptable levels. The elimination of bottlenecks enables more work to be performed while maintaining response time below acceptable service level threshold limits.


Figure-3: I/O response time performance impact

Seasonal and peak workload I/O bottlenecks
Another common challenge and cause of I/O bottlenecks is seasonal and/or unplanned workload increases that result in application delays and frustrated customers. In Figure-4 a workload representing an eCommerce transaction based system is shown with seasonal spikes in activity (dotted curve). The resulting impact to response time (solid curve) is shown in relation to a threshold line of acceptable response time performance. For example, peaks due holiday shopping exchanges appear in January then dropping off increasing near mother’s day in May, then back to school shopping in August results in increased activity as does holiday shopping starting in late November.


Figure-4: I/O bottleneck impact from surge workload activity

Compensating for lack of performance
Besides impacting user productivity due to poor performance, I/O bottlenecks can result in system instability or unplanned application downtime. One only needs to recall recent electric power grid outages that were due to instability, insufficient capacity bottlenecks as a result of increased peak user demand.

I/O performance improvement approaches to address I/O bottlenecks have been to do nothing (incur and deal with the service disruptions) or over configure by throwing more hardware and software at the problem. To compensate for lack of I/O performance and counter the resulting negative impact to IT users, a common approach is to add more hardware to mask or move the problem.

However, this often leads to extra storage capacity being added to make up for a short fall in I/O performance. By over configuring to support peak workloads and prevent loss of business revenue, excess storage capacity must be managed throughout the non-peak periods, adding to data center and management costs. The resulting ripple affect is that now more storage needs to be managed, including allocating storage network ports, configuring, tuning, and backing up of data. This can and does result in environments that have storage utilization well below 50% of their useful storage capacity. The solution is to address the problem rather than moving and hiding the bottleneck elsewhere (rather like sweeping dust under the rug).

Business value of improved performance
Putting a value on the performance of applications and their importance to your business is a necessary step in the process of deciding where and what to focus on for improvement. For example, what is the value of reducing application response time and the associated business benefit of allowing more transactions, reservations or sales to be made? Likewise, what is the value of improving the productivity of a designer or animator to meet tight deadlines and market schedules? What is business benefit of enabling a customer to search faster for and item, place an order, access media rich content, or in general improve their productivity?

Server and I/O performance gap as a data center bottleneck
I/O performance bottlenecks are a wide spread issue across most data centers, affecting many applications and industries. Applications impacted by data center I/O bottlenecks to be looked at in more depth are electronic design automation (EDA), entertainment and media, database online transaction processing (OLTP) and business intelligence. These application categories represent transactional processing, shared file access for collaborative work, and processing of shared, time sensitive data.

Electronic design
Computer aided design (CAD), computer assisted engineering (CAE), electronic design automaton (EDA) and other design tools are used for a wide variety of engineering and design functions. These design tools require fast access to shared, secured and protected data. The objective of using EDA and other tools is to enable faster product development with better quality and improved worker productivity. Electronic components manufactured for the commercial, consumer and specialized markets rely on design tools to speed the time-to-market of new products as well as to improve engineer productivity.

EDA tools, including those from Cadence, Synopsis, Mentor Graphics and others, are used to develop expensive and time sensitive electronic chips, along with circuit boards and other components to meet market windows and suppler deadlines. An example of this is a chip vendor being able to simulate, develop, test, produce and deliver a new chip in time for manufacturers to release their new products based on those chips. Another example is aerospace and automotive engineering firms leveraging design tools, including CATIA and UGS, on a global basis relying on their suppler networks to do the same in a real-time, collaborative manner to improve productivity and time-to-market. These results in contention of shared file and data access and, as a work-around, more copies of data kept as local buffers.

I/O performance impacts and challenges for EDA, CAE and CAD systems include:

  • Delays in drawing and file access resulting in lost productivity and project delays
  • Complex configurations to support computer farms (server grids) for I/O and storage performance
  • Proliferation of dedicated storage on individual servers and workstations to improve performance

Entertainment and media
While some applications are characterized by high bandwidth or throughput, such as streaming video and digital intermediate (DI) processing of 2K (2048 pixels per line) and 4K (4096 pixels per line) video and film, there are many other applications that are also impacted by I/O performance time delays. Even bandwidth intensive applications for video production and other applications are time sensitive and vulnerable to I/O bottleneck delays. For example, cell phone ring tone, instant messaging, small MP3 audio, and voice- and e-mail are impacted by congestion and resource contention.

Prepress production and publishing requiring assimilation of many small documents, files and images while undergoing revisions can also suffer. News and information websites need to look up breaking stories, entertainment sites need to view and download popular music, along with still images and other rich content; all of this can be negatively impacted by even small bottlenecks.  Even with streaming video and audio, access to those objects requires accessing some form of a high speed index to locate where the data files are stored for retrieval. These indexes or databases can become bottlenecks preventing high performance storage and I/O systems from being fully leveraged.

Index files and databases must be searched to determine the location where images and objects, including streaming media, are stored. Consequently, these indices can become points of contention resulting in bottlenecks that delay processing of streaming media objects. When cell phone picture is taken phone and sent to someone, chances are that the resulting image will be stored on network attached storage (NAS) as a file with a corresponding index entry in a database at some service provider location. Think about what happens to those servers and storage systems when several people all send photos at the same time.

I/O performance impacts and challenges for entertainment and media systems include:

  • Delays in image and file access resulting in lost productivity
  • Redundant files and storage local servers to improve performance
  • Contention for resources causing further bottlenecks during peak workload surges

OLTP and business intelligence
Surges in peak workloads result in performance bottlenecks on database and file servers, impacting time sensitive OLTP systems unless they are over configured for peak demand. For example, workload spikes due to holiday and back-to-school shopping, spring break and summer vacation travel reservations, Valentines or Mothers Day gift shopping, and clearance and settlement on peak stock market trading days strain fragile systems. For database systems maintaining performance for key objects, including transaction logs and journals, it is important to eliminate performance issues as well as maintain transaction and data integrity.

An example tied to eCommerce is business intelligence systems (not to be confused with back office marketing and analytics systems for research). Online business intelligence systems are popular with online shopping and services vendors who track customer interests and previous purchases to tailor search results, views and make suggestions to influence shopping habits.

Business intelligence systems need to be fast and support rapid lookup of history and other information to provide purchase histories and offer timely suggestions. The relative performance improvements of processors shift the application bottlenecks from the server to the storage access network. These applications have, in some cases, resulted in an exponential increase in query or read operations beyond the capabilities of single database and storage instances, resulting in database deadlock and performance problems or the proliferation of multiple data copies and dedicated storage on application servers.

A more recent contribution to performance challenges, caused by the increased availability of on-line shopping and price shopping search tools, is low cost craze (LCC) or price shopping. LCC has created a dramatic increase in the number of read or search queries taking place, further impacting database and file systems performance. For example, an airline reservation system that supports price shopping while preventing impact to time sensitive transactional reservation systems would create multiple read-only copies of reservations databases for searches. The result is that more copies of data must be maintained across more servers and storage systems thus increasing costs and complexity. While expensive, the alternative of doing nothing results in lost business and market share.

I/O performance impacts and challenges for OLTP and business intelligence systems include:

  • Application and database contention, including deadlock conditions, due to slow transactions
  • Disruption to application servers to install special monitoring, load balance or I/O driver software
  • Increased management time required to support additional storage needed as a I/O workaround

Summary/Conclusion
It is vital to understand the value of performance, including response time or latency, and numbers of I/O operations for each environment and particular application. While the cost per raw TByte may seem relatively in-expensive, the cost for I/O response time performance also needs to be effectively addressed and put into the proper context as part of the data center QoS cost structure.

There are many approaches to address data center I/O performance bottlenecks with most centered on adding more hardware or addressing bandwidth or throughput issues. Time sensitive applications depend on low response time as workload including throughput increase and thus latency can not be ignored. The key to removing data center I/O bottlenecks is to find and address the problem instead of simply moving or hiding it with more hardware and/or software. Simply adding fast devices such as SSD may provide relief, however if the SSDs are attached to high latency storage controllers, the full benefit may not be realized. Thus, identify and gain insight into data center and I/O bottleneck paths eliminating issues and problems to boost productivity and efficiency.

Where to Learn More
Additional information about IT data center, server, storage as well as I/O networking bottlenecks along with solutions can be found at the Server and StorageIO website in the tips, tools and white papers, as well as news, books, and activity on the events pages. If you are in the New York area on September 23, 2009, check out my presentation on The Other Green – Storage Optimization and Efficiency that will touch on the above and other related topics. Download your copy of "IT Data Center and Storage Bottlenecks" by clicking here.

Ok, nuff said.

Cheers gs

Greg Schulz – Author Cloud and Virtual Data Storage Networking (CRC Press), The Green and Virtual Data Center (CRC Press) and Resilient Storage Networks (Elsevier)
twitter @storageio

All Comments, (C) and (TM) belong to their owners/posters, Other content (C) Copyright 2006-2024 Server StorageIO and UnlimitedIO LLC All Rights Reserved

Upcoming Out and About Events

Following up on previous Out and About updates ( here and here ) of where I have been, heres where I’m going to be over the next couple of weeks.

On September 15th and 16th 2009, I will be the keynote speaker along with doing a deep dive discussion around data deduplication in Minneapolis, MN and Toronto ON. Free Seminar, register and learn more here.

The Infrastructure Optimization and Planning Best Practices (V2.009) – Doing more with less without sacrificing storage, system or network capabilities Seminar series continues September 22, 2009 with a stop in Chicago. Free Seminar, register and learn more here.

On September 23, 2009 I will be in New York City at Storage Decisions conference participating in the Ask the Experts during the expo session as well as presenting The Other Green — Storage Efficiency and Optimization.

Throw out the "green“: buzzword, and you’re still left with the task of saving or maximizing use of space, power, and cooling while stretching available IT dollars to support growth and business sustainability. For some environments the solution may be consolation while others need to maintain quality of service response time, performance and availability necessitating faster, energy efficient technologies to achieve optimization objectives. To accomplish these and other related issues, you can turn to the cloud, virtualization, intelligent power management, data footprint reduction and data management not to mention various types of tiered storage and performance optimization techniques. The session will look at various techniques and strategies to optimize either on-line active or primary as well as near-line or secondary storage environment during tough economic times, as well as to position for future growth, after all, there is no such thing as a data recession!

Topics, technologies and techniques that will be discussed include among others:

  • Energy efficiency (strategic) vs. energy avoidance (tactical)
  • Optimization and the need for speed vs. the need for capacity
  • Metrics and measurements for management insight
  • Tiered storage and tiered access including SSD, FC, SAS and clouds
  • Data footprint reduction (archive, compress, dedupe) and thin provision
  • Best practices, financial incentives and what you can do today

Free event, learn more and register here.

Check out the events page for other upcoming events and hope to see you this fall while Im out and about.

Cheers – gs

Greg Schulz – StorageIOblog, twitter @storageio Author “The Green and Virtual Data Center” (CRC)

Is There a Data and I/O Activity Recession?

Storage I/O trends

With all the focus on both domestic and international economic woes and discussion of recessions and depressions and possible future rapid inflation, recent conversations with IT professionals from organizations of all size across different industry sectors and geographies prompted the question, is there also a data and I/O activity recession?

Here’s the premise, if you listen to current economic and financial reports as well as employment information, the immediate conclusion is that yes, there should also be an I recession in the form of contraction in the amount of data being processed, moved and stored which would also impact I/O (e.g. DAS,, LAN, SAN, FAN or NAS, MAN, WAN) networking activity as well. After all, the server, storage, I/O and networking vendors earnings are all being impacted right?

As is often the case, there is more to the story, certainly vendor earnings are down and some vendors are shipping less product than during corresponding periods from a year or more ago. Likewise, I continue to hear from both IT organizations, vars and vendors of lengthened sales cycles due to increased due diligence and more security of IT acquisitions meaning that sales and revenue forecasts continue to be very volatile with some vendors pulling back on their future financial guidance.

However, does that mean fewer servers, storage, I/O and networking components not to mention less software is being shipped? In some cases there is or has been a slow down. However in other cases, due to pricing pressures, increased performance and capacity density where more work can be done by fewer devices, consolidation, data footprint reduction, optimization, virtualization including VMware and other techniques, not to mention a decrease in some activity, there is less demand. On the other hand, while some retail vendors are seeing their business volume decrease, others such as Amazon are seeing continued heavy demand and activity.

Been on a trip lately through an airport? Granted the airlines have instituted capacity management (e.g. capacity planning) and fleet optimization to align the number of flights or frequency as well as aircraft type (tiering) to the demand. In some cases smaller planes, in other cases larger planes, for some more stops at a lower price (trade time for money) or in other cases shorter direct routes for a higher fee. The point being is that while there is an economic recession underway, and granted there are fewer flights, many if not most of those flights are full which means transactions and information to process by the airlines reservations and operational as well as customer relations and loyalty systems.

Mergers and acquisitions usually mean a reduction or consolidation of activity resulting in excess and surplus technologies, yet talking with some financial services organizations, over time some of their systems will be consolidated to achieve operating efficiency and synergies, near term, in some cases, there is the need for more IT resources to support the increased activity of supporting multiple applications, increased customer inquiry and conversion activity.

On a go forward basis, there is the need to support more applications and services that will generate more I/O activity to enable data to be moved, processed and stored. Not to mention, data being retained in multiple locations for longer periods of time to meet both compliance and non regulatory compliance requirements as well as for BC/DR and business intelligence (BI) or data mining for marketing and other purposes.

Speaking of the financial sector, while the economic value of most securities is depressed, and with the wild valuation swings in the stock markets, the result is more data to process, move and store on a daily basis, all of which continues to place more demand on IT infrastructure resources including servers, storage, I/O networking, software, facilities and the people to support them.

Dow Jones Trading Activity Volume
Dow Jones Trading Activity Volume (Courtesy of data360.org)

For example, the amount of Dow Jones trading activity is on a logarithmic upward trend curve in the example chart from data360.org which means more transactions selling and buying. The result of more transactions is that there are also an increase in the number of back-office functions for settlement, tracking, surveillance, customer inquiry and reporting among others activities. This means that more I/Os are generated with data to be moved, processed, replicated, backed-up with additional downstream activity and processing.

Shifting gears, same things with telephone and in particular cell phone traffic which indirectly relates on IT systems particular for support email and other messaging activity. Speaking of email, more and more emails are sent every day, granted many are spam, yet these all result in more activity as well as data.

What’s the point in all of this?

There is a common awareness among most IT professionals that there is more data generated and stored every year and that there is also an awareness of the increased threats and reliance upon data and information. However what’s either not as widely discussed is the increase in I/O and networking activity. That is, the space capacity often gets talked about, however, the I/O performance, response time, activity and data movement can be forgotten about or its importance to productivity diminished. So the point is, keep performance, response time, and latency in focus as well as IOPS and bandwidth when looking at, and planning IT infrastructure to avoid data center bottlenecks.

Finally for now, what’s your take, is there a data and/or I/O networking recession, or is it business and activity as usual?

Ok, nuff said.

Cheers gs

Greg Schulz – Author Cloud and Virtual Data Storage Networking (CRC Press), The Green and Virtual Data Center (CRC Press) and Resilient Storage Networks (Elsevier)
twitter @storageio

All Comments, (C) and (TM) belong to their owners/posters, Other content (C) Copyright 2006-2024 Server StorageIO and UnlimitedIO LLC All Rights Reserved