Part 2 – Which HDD for Content Applications – HDD Testing

Part 2 – Which HDD for Content Applications – HDD Testing

HDD testing server storage I/O trends

Updated 1/23/2018

Which enterprise HDD to use with a content server, hdd testing, how and what to do

Insight for effective server storage I/O decision making
Server StorageIO Lab Review

Which enterprise HDD to use for content servers

This is the second in a multi-part series (read part one here) based on a white paper hands-on lab report I did compliments of Servers Direct and Seagate that you can read in PDF form here. The focus is looking at the Servers Direct (www.serversdirect.com) converged Content Solution platforms with Seagate Enterprise Hard Disk Drive (HDD’s). In this post we look at some decisions and configuration choices to make for testing content applications servers as well as project planning.

Content Solution Test Objectives

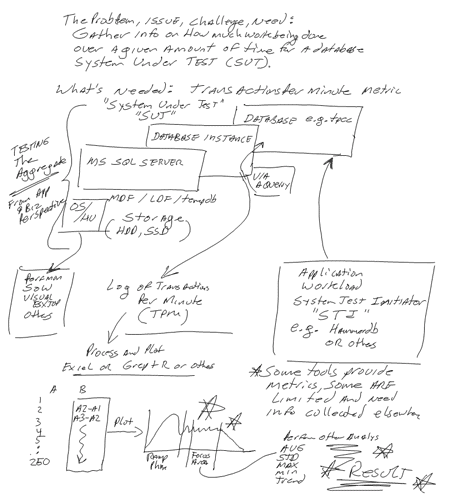
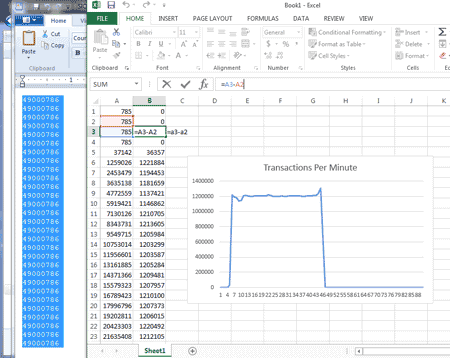
In short period, collect performance and another server, storage I/O decision-making information on various HDD’s running different content workloads.

Working with the Servers Direct staff a suitable content solution platform test configuration was created. In addition to providing two Intel-based content servers, Servers Direct worked with their partner Seagate to arrange for various enterprise-class HDD’s to be evaluated. For these series of content application tests, being short on time, I chose to do run some simple workloads including database, basic file (large and small) processing and general performance characterization.

Content Solution Decision Making

Knowing how Non-Volatile Memory (NVM) NAND flash SSD (1) devices (drives and PCIe cards) perform, what would be the best HDD based storage option for my given set of applications? Different applications have various performance, capacity and budget considerations. Different types of Seagate Enterprise class 2.5” Small Form Factor (SFF) HDD’s were tested.

While revolutions per minute (RPM) still plays a role in HDD performance, there are other factors including internal processing capabilities, software or firmware algorithm optimization, and caching. Most HDD’s today have some amount of DRAM for read caching and other operations. Seagate Enterprise Performance HDD’s with the enhanced caching feature (2) are examples of devices accelerate storage I/O speed vs. traditional 10K and 15K RPM drives.

Project Planning And Preparation

Workload to be tested included:

  • Database read/writes
  • Large file processing
  • Small file processing
  • General I/O profile

Project testing consisted of five phases, some of which overlapped with others:

Phase 1 – Plan
Identify candidate workloads that could be run in the given amount of time, determine time schedules and resource availability, create a project plan.

Phase 2 – Define
Hardware define and software define the test platform.

Phase 3 – Setup
The objective was to assess plug-play capability of the server, storage and I/O networking hardware with a Linux OS before moving on to the reported workloads in the next phase. Initial setup and configuration of hardware and software, installation of additional devices along with software configuration, troubleshooting, and learning as applicable. This phase consisted of using Ubuntu Linux 14.04 server as the operating system (OS) along with MySQL 5.6 as a database server during initial hands-on experience.

Phase 4 – Execute
This consisted of using Windows 2012 R2 server as the OS along with Microsoft SQL Server on the system under test (SUT) to support various workloads. Results of this phase are reported below.

Phase 5 – Analyze      
Results from the workloads run in phase 3 were analyzed and summarized into this document.

(Note 1) Refer to Seagate 1200 12 Gbps Enterprise SAS SSD StorageIO lab review

(Note 2) Refer to Enterprise SSHD and Flash SSD Part of an Enterprise Tiered Storage Strategy

Planning And Preparing The Tests

As with most any project there were constraints to contend with and work around.

Test constraints included:

  • Short-time window
  • Hardware availability
  • Amount of hardware
  • Software availability

Three most important constraints and considerations for this project were:

  • Time – This was a project with a very short time “runway”, something common in most customer environments who are looking to make a knowledgeable server, storage I/O decisions.
  • Amount of hardware – Limited amount of DRAM main memory, sixteen 2.5” internal hot-swap storage slots for HDD’s as well as SSDs. Note that for a production content solution platform; additional DRAM can easily be added, along with extra external storage enclosures to scale memory and storage capacity to fit your needs.
  • Software availability – Utilize common software and management tools publicly available so anybody could leverage those in their own environment and tests.

The following content application workloads were profiled:

  • Database reads/writes – Updates, inserts, read queries for a content environment
  • Large file processing – Streaming of large video, images or other content objects.
  • Small file processing – Processing of many small files found in some content applications
  • General I/O profile – IOP, bandwidth and response time relevant to content applications

Where To Learn More

Additional learning experiences along with common questions (and answers), as well as tips can be found in Software Defined Data Infrastructure Essentials book.

Software Defined Data Infrastructure Essentials Book SDDC

What This All Means

There are many different types of content applications ranging from little data databases to big data analytics as well as very big fast data such as for video. Likewise there are various workloads and characteristics to test. The best test and metrics are those that apply to your environment and application needs.

Continue reading part three of this multi-part series here looking at how the systems and HDD’s were configured and tested.

Ok, nuff said, for now.

Gs

Greg Schulz – Microsoft MVP Cloud and Data Center Management, VMware vExpert 2010-2017 (vSAN and vCloud). Author of Software Defined Data Infrastructure Essentials (CRC Press), as well as Cloud and Virtual Data Storage Networking (CRC Press), The Green and Virtual Data Center (CRC Press), Resilient Storage Networks (Elsevier) and twitter @storageio. Courteous comments are welcome for consideration. First published on https://storageioblog.com any reproduction in whole, in part, with changes to content, without source attribution under title or without permission is forbidden.

All Comments, (C) and (TM) belong to their owners/posters, Other content (C) Copyright 2006-2024 Server StorageIO and UnlimitedIO. All Rights Reserved. StorageIO is a registered Trade Mark (TM) of Server StorageIO.

Part 4 – Which HDD for Content Applications – Database Workloads

Part 4 – Which HDD for Content Applications – Database Workloads

data base server storage I/O trends

Updated 1/23/2018
Which enterprise HDD to use with a content server platform for database workloads

Insight for effective server storage I/O decision making
Server StorageIO Lab Review

Which enterprise HDD to use for content servers

This is the fourth in a multi-part series (read part three here) based on a white paper hands-on lab report I did compliments of Servers Direct and Seagate that you can read in PDF form here. The focus is looking at the Servers Direct (www.serversdirect.com) converged Content Solution platforms with Seagate Enterprise Hard Disk Drive (HDD’s). In this post the focus expands to database application workloads that were run to test various HDD’s.

Database Reads/Writes

Transaction Processing Council (TPC) TPC-C like workloads were run against the SUT from the STI. These workloads simulated transactional, content management, meta-data and key-value processing. Microsoft SQL Server 2012 was configured and used with databases (each 470GB e.g. scale 6000) created and workload generated by virtual users via Dell Benchmark Factory (running on STI Windows 2012 R2).

A single SQL Server database instance (8) was used on the SUT, however unique databases were created for each HDD set being tested. Both the main database file (.mdf) and the log file (.ldf) were placed on the same drive set being tested, keep in mind the constraints mentioned above. As time was a constraint, database workloads were run concurrent (9) with each other except for the Enterprise 10K RAID 1 and RAID 10. Workload was run with two 10K HDD’s in a RAID 1 configuration, then another workload run with a four drive RAID 10. In a production environment, ideally the .mdf and .ldf would be placed on separate HDD’s and SSDs.

To improve cache buffering the SQL Server database instance memory could be increased from 16GB to a larger number that would yield higher TPS numbers. Keep in mind the objective was not to see how fast I could make the databases run, rather how the different drives handled the workload.

(Note 8) The SQL Server Tempdb was placed on a separate NVMe flash SSD, also the database instance memory size was set to 16GB which was shared by all databases and virtual users accessing it.

(Note 9) Each user step was run for 90 minutes with a 30 minute warm-up preamble to measure steady-state operation.

Users

TPCC Like TPS

Single Drive Cost per TPS

Drive Cost per TPS

Single Drive Cost / Per GB Raw Cap.

Cost / Per GB Usable (Protected) Cap.

Drive Cost (Multiple Drives)

Protect
Space Over head

Cost per usable GB per TPS

Resp. Time (Sec.)

ENT 15K R1

1

23.9

$24.94

$49.89

$0.99

$0.99

$1,190

100%

$49.89

0.01

ENT 10K R1

1

23.4

$37.38

$74.77

$0.49

$0.49

$1,750

100%

$74.77

0.01

ENT CAP R1

1

16.4

$24.26

$48.52

$0.20

$0.20

$ 798

100%

$48.52

0.03

ENT 10K R10

1

23.2

$37.70

$150.78

$0.49

$0.97

$3,500

100%

$150.78

0.07

ENT CAP SWR5

1

17.0

$23.45

$117.24

$0.20

$0.25

$1,995

20%

$117.24

0.02

ENT 15K R1

20

362.3

$1.64

$3.28

$0.99

$0.99

$1,190

100%

$3.28

0.02

ENT 10K R1

20

339.3

$2.58

$5.16

$0.49

$0.49

$1,750

100%

$5.16

0.01

ENT CAP R1

20

213.4

$1.87

$3.74

$0.20

$0.20

$ 798

100%

$3.74

0.06

ENT 10K R10

20

389.0

$2.25

$9.00

$0.49

$0.97

$3,500

100%

$9.00

0.02

ENT CAP SWR5

20

216.8

$1.84

$9.20

$0.20

$0.25

$1,995

20%

$9.20

0.06

ENT 15K R1

50

417.3

$1.43

$2.85

$0.99

$0.99

$1,190

100%

$2.85

0.08

ENT 10K R1

50

385.8

$2.27

$4.54

$0.49

$0.49

$1,750

100%

$4.54

0.09

ENT CAP R1

50

103.5

$3.85

$7.71

$0.20

$0.20

$ 798

100%

$7.71

0.45

ENT 10K R10

50

778.3

$1.12

$4.50

$0.49

$0.97

$3,500

100%

$4.50

0.03

ENT CAP SWR5

50

109.3

$3.65

$18.26

$0.20

$0.25

$1,995

20%

$18.26

0.42

ENT 15K R1

100

190.7

$3.12

$6.24

$0.99

$0.99

$1,190

100%

$6.24

0.49

ENT 10K R1

100

175.9

$4.98

$9.95

$0.49

$0.49

$1,750

100%

$9.95

0.53

ENT CAP R1

100

59.1

$6.76

$13.51

$0.20

$0.20

$ 798

100%

$13.51

1.66

ENT 10K R10

100

560.6

$1.56

$6.24

$0.49

$0.97

$3,500

100%

$6.24

0.14

ENT CAP SWR5

100

62.2

$6.42

$32.10

$0.20

$0.25

$1,995

20%

$32.10

1.57

Table-2 TPC-C workload results various number of users across different drive configurations

Figure-2 shows TPC-C TPS (red dashed line) workload scaling over various number of users (1, 20, 50, and 100) with peak TPS per drive shown. Also shown is the used space capacity (in green), with total raw storage capacity in blue cross hatch. Looking at the multiple metrics in context shows that the 600GB Enterprise 15K HDD with performance enhanced cache is a premium option as an alternative, or, to complement flash SSD solutions.

database TPCC transactional workloads
Figure-2 472GB Database TPS scaling along with cost per TPS and storage space used

In figure-2, the 1.8TB Enterprise 10K HDD with performance enhanced cache while not as fast as the 15K, provides a good balance of performance, space capacity and cost effectiveness. A good use for the 10K drives is where some amount of performance is needed as well as a large amount of storage space for less frequently accessed content.

A low cost, low performance option would be the 2TB Enterprise Capacity HDD’s that have a good cost per capacity, however lack the performance of the 15K and 10K drives with enhanced performance cache. A four drive RAID 10 along with a five drive software volume (Microsoft WIndows) are also shown. For apples to apples comparison look at costs vs. capacity including number of drives needed for a given level of performance.

Figure-3 is a variation of figure-2 showing TPC-C TPS (blue bar) and response time (red-dashed line) scaling across 1, 20, 50 and 100 users. Once again the Enterprise 15K with enhanced performance cache feature enabled has good performance in an apples to apples RAID 1 comparison.

Note that the best performance was with the four drive RAID 10 using 10K HDD’s Given popularity, a four drive RAID 10 configuration with the 10K drives was used. Not surprising the four 10K drives performed better than the RAID 1 15Ks. Also note using five drives in a software spanned volume provides a large amount of storage capacity and good performance however with a larger drive footprint.

database TPCC transactional workloads scaling
Figure-3 472GB Database TPS scaling along with response time (latency)

From a cost per space capacity perspective, the Enterprise Capacity drives have a good cost per GB. A hybrid solution for environment that do not need ultra-high performance would be to pair a small amount of flash SSD (10) (drives or PCIe cards), as well as the 10K and 15K performance enhanced drives with the Enterprise Capacity HDD (11) along with cache or tiering software.

(Note 10) Refer to Seagate 1200 12 Gbps Enterprise SAS SSD StorageIO lab review

(Note 11) Refer to Enterprise SSHD and Flash SSD Part of an Enterprise Tiered Storage Strategy

Where To Learn More

Additional learning experiences along with common questions (and answers), as well as tips can be found in Software Defined Data Infrastructure Essentials book.

Software Defined Data Infrastructure Essentials Book SDDC

What This All Means

If your environment is using applications that rely on databases, then test resources such as servers, storage, devices using tools that represent your environment. This means moving up the software and technology stack from basic storage I/O benchmark or workload generator tools such as Iometer among others instead using either your own application, or tools that can replay or generate various workloads that represent your environment.

Continue reading part five in this multi-part series here where the focus shifts to large and small file I/O processing workloads.

Ok, nuff said, for now.

Gs

Greg Schulz – Microsoft MVP Cloud and Data Center Management, VMware vExpert 2010-2017 (vSAN and vCloud). Author of Software Defined Data Infrastructure Essentials (CRC Press), as well as Cloud and Virtual Data Storage Networking (CRC Press), The Green and Virtual Data Center (CRC Press), Resilient Storage Networks (Elsevier) and twitter @storageio. Courteous comments are welcome for consideration. First published on https://storageioblog.com any reproduction in whole, in part, with changes to content, without source attribution under title or without permission is forbidden.

All Comments, (C) and (TM) belong to their owners/posters, Other content (C) Copyright 2006-2024 Server StorageIO and UnlimitedIO. All Rights Reserved. StorageIO is a registered Trade Mark (TM) of Server StorageIO.

Collecting Transaction Per Minute from SQL Server and HammerDB

Storage I/O trends

Collecting Transaction Per Minute from SQL Server and HammerDB

When using benchmark or workload generation tools such as HammerDB I needed a way to capture and log performance activity metrics such as transactions per minute. For example using HammerDB to simulate an application making database requests performing various transactions as part of testing an overall system solution including server and storage I/O activity. This post takes a look at the problem or challenge I was looking to address, as well as creating a solution after spending time searching for one (still searching btw).

The Problem, Issue, Challenge, Opportunity and Need

The challenge is to collect application performance such as transactions per minute from a workload using a database. The workload or benchmark tool (in this case HammerDB) is the System Test Initiator (STI) that drives the activity (e.g. database requests) to a System Under Test (SUT). In this example the SUT is a Microsoft SQL Server running on a Windows 2012 R2 server. What I need is to collect and log into a file for later analysis the transaction rate per minute while the STI is generating a particular workload.

Server Storage I/O performance

Understanding the challenge and designing a strategy

If you have ever used benchmark or workload generation tools such as Quest Benchmark Factory (part of the Toad tools collection) you might be spoiled with how it can be used to not only generate the workload, as well as collect, process, present and even store the results for database workloads such as TPC simulations. In this situation, Transaction Processing Council (TPC) like workloads need to be run and metrics on performance collected. Lets leave Benchmark Factory for a future discussion and focus instead on a free tool called HammerDB and more specifically how to collection transactions per minute metrics from Microsoft SQL Server. While the focus is SQL Server, you can easily adapt the approach for MySQL among others, not to mention there are tools such as Sysbench, Aerospike among other tools.

The following image (created using my Livescribe Echo digital pen) outlines the problem, as well as sketches out a possible solution design. In the following figure, for my solution I’m going to show how to grab every minute for a given amount of time the count of transactions that have occurred. Later in the post processing (you could also do in the SQL Script) I take the new transaction count (which is cumulative) and subtract the earlier interval which yields the transactions per minute (see examples later in this post).

collect TPM metrics from SQL Server with hammerdb
The problem and challenge, a way to collect Transactions Per Minute (TPM)

Finding a solution

HammerDB displays results via its GUI, and perhaps there is a way or some trick to get it to log results to a file or some other means, however after searching the web, found that it was quicker to come up with solution. That solution was to decide how to collect and report the transactions per minute (or you could do by second or other interval) from Microsoft SQL Server. The solution was to find what performance counters and metrics are available from SQL Server, how to collect those and log them to a file for processing. What this means is a SQL Server script file would need to be created that ran in a loop collecting for a given amount of time at a specified interval. For example once a minute for several hours.

Taking action

The following is a script that I came up with that is far from optimal however it gets the job done and is a starting point for adding more capabilities or optimizations.

In the following example, set loopcount to some number of minutes to collect samples for. Note however that if you are running a workload test for eight (8) hours with a 30 minute ramp-up time, you would want to use a loopcount (e.g. number of minutes to collect for) of 480 + 30 + 10. The extra 10 minutes is to allow for some samples before the ramp and start of workload, as well as to give a pronounced end of test number of samples. Add or subtract however many minutes to collect for as needed, however keep this in mind, better to collect a few extra minutes vs. not have them and wished you did.

-- Note and disclaimer:
-- 
-- Use of this code sample is at your own risk with Server StorageIO and UnlimitedIO LLC
-- assuming no responsibility for its use or consequences. You are free to use this as is
-- for non-commercial scenarios with no warranty implied. However feel free to enhance and
-- share those enhancements with others e.g. pay it forward.
-- 
DECLARE @cntr_value bigint;
DECLARE @loopcount bigint; # how many minutes to take samples for

set @loopcount = 240

SELECT @cntr_value = cntr_value
 FROM sys.dm_os_performance_counters
 WHERE counter_name = 'transactions/sec'
 AND object_name = 'MSSQL$DBIO:Databases'
 AND instance_name = 'tpcc' ; print @cntr_value;
 WAITFOR DELAY '00:00:01'
-- 
-- Start loop to collect TPM every minute
-- 

while @loopcount <> 0
begin
SELECT @cntr_value = cntr_value
 FROM sys.dm_os_performance_counters
 WHERE counter_name = 'transactions/sec'
 AND object_name = 'MSSQL$DBIO:Databases'
 AND instance_name = 'tpcc' ; print @cntr_value;
 WAITFOR DELAY '00:01:00'
 set @loopcount = @loopcount - 1
end
-- 
-- All done with loop, write out the last value
-- 
SELECT @cntr_value = cntr_value
 FROM sys.dm_os_performance_counters
 WHERE counter_name = 'transactions/sec'
 AND object_name = 'MSSQL$DBIO:Databases'
 AND instance_name = 'tpcc' ; print @cntr_value;
-- 
-- End of script
-- 

The above example has loopcount set to 240 for a 200 minute test with a 30 minute ramp and 10 extra minutes of samples. I use the a couple of the minutes to make sure that the system test initiator (STI) such as HammerDB is configured and ready to start executing transactions. You could also put this along with your HammerDB items into a script file for further automation, however I will leave that exercise up to you.

For those of you familiar with SQL and SQL Server you probably already see some things to improve or stylized or simply apply your own preference which is great, go for it. Also note that I’m only selecting a certain variable from the performance counters as there are many others which you can easily discovery with a couple of SQL commands (e.g. select and specify database instance and object name. Also note that the key is accessing the items in sys.dm_os_performance_counters of your SQL Server database instance.

The results

The output from the above is a list of cumulative numbers as shown below which you will need to post process (or add a calculation to the above script). Note that part of running the script is specifying an output file which I show later.

785
785
785
785
37142
1259026
2453479
3635138

Implementing the solution

You can setup the above script to run as part of a larger automation shell or batch script, however for simplicity I’m showing it here using Microsoft SQL Server Studio.

SQL Server script to collect TPM
Microsoft SQL Server Studio with script to collect Transaction Per Minute (TPM)

The following image shows how to specify an output file for the results to be logged to when using Microsoft SQL Studio to run the TPM collection script.

Specify SQL Server tpm output file
Microsoft SQL Server Studio specify output file

With the SQL Server script running to collect results, and HammerDB workload running to generate activity, the following shows Quest Spotlight on Windows (SoW) displaying WIndows Server 2012 R2 operating system level performance including CPU, memory, paging and other activity. Note that this example had about the system test initiator (STI) which is HammerDB and the system under test (SUT) that is Microsoft SQL Server on the same server.

Spotlight on Windows while SQL Server doing tpc
Quest Spotlight on Windows showing Windows Server performance activity

Results and post-processing

As part of post processing simple use your favorite tool or script or what I often do is pull the numbers into Excel spreadsheet, and simply create a new column of numbers that computes and shows the difference between each step (see below). While in Excel then I plot the numbers as needed which can also be done via a shell script and other plotting tools such as R.

In the following example, the results are imported into Excel (your favorite tool or script) where I then add a column (B) that simple computes the difference between the existing and earlier counter. For example in cell B2 = A2-A1, B3 = A3-A2 and so forth for the rest of the numbers in column A. I then plot the numbers in column B to show the transaction rates over time that can then be used for various things.

Hammerdb TPM results from SQL Server processed in Excel
Results processed in Excel and plotted

Note that in the above results that might seem too good to be true they are, these were cached results to show the tools and data collection process as opposed to the real work being done, at least for now…

Where to learn more

Here are some extra links to have a look at:

How to test your HDD, SSD or all flash array (AFA) storage fundamentals
Server and Storage I/O Benchmarking 101 for Smarties
Server and Storage I/O Benchmark Tools: Microsoft Diskspd (Part I)
The SSD Place (collection of flash and SSD resources)
Server and Storage I/O Benchmarking and Performance Resources
I/O, I/O how well do you know about good or bad server and storage I/Os?

What this all means and wrap-up

There are probably many ways to fine tune and optimize the above script, likewise there may even be some existing tool, plug-in, add-on module, or configuration setting that allows HammerDB to log the transaction activity rates to a file vs. simply showing on a screen. However for now, this is a work around that I have found for when needing to collect transaction activity performance data with HammerDB and SQL Server.

Ok, nuff said, for now…

Cheers gs

Greg Schulz – Author Cloud and Virtual Data Storage Networking (CRC Press), The Green and Virtual Data Center (CRC Press) and Resilient Storage Networks (Elsevier)
twitter @storageio

All Comments, (C) and (TM) belong to their owners/posters, Other content (C) Copyright 2006-2024 Server StorageIO and UnlimitedIO LLC All Rights Reserved